© 2026 ALLCITY Network Inc.
All rights reserved.


In sports, sometimes you win.
Sometimes you lose.
And sometimes you lose a lot.

Such has been the case for the Colorado Avalanche of late. The team is entering the final days before the trade deadline while clinging to the final wild card spot by the tips of their fingers. Their 25-24-11 record, good for 61 points in 60 games, edged them back into the eight seed after a rare win only last night.
Overall, they sit 19th in the league and own an 83-point pace. For anyone keeping score at home, that’s a projected 12-point drop from the 95 they posted last year.
Even though it may not feel like it, overall, the Avs seem to be an average team with average results. When you look at their stats report card, there’s not much that stands out to the contrary. The penalty kill and one goal game win percentage is low, the power play is a bit high, and everything else is decidedly close to league average.
It’s exactly what you’d expect to see from a bubble team.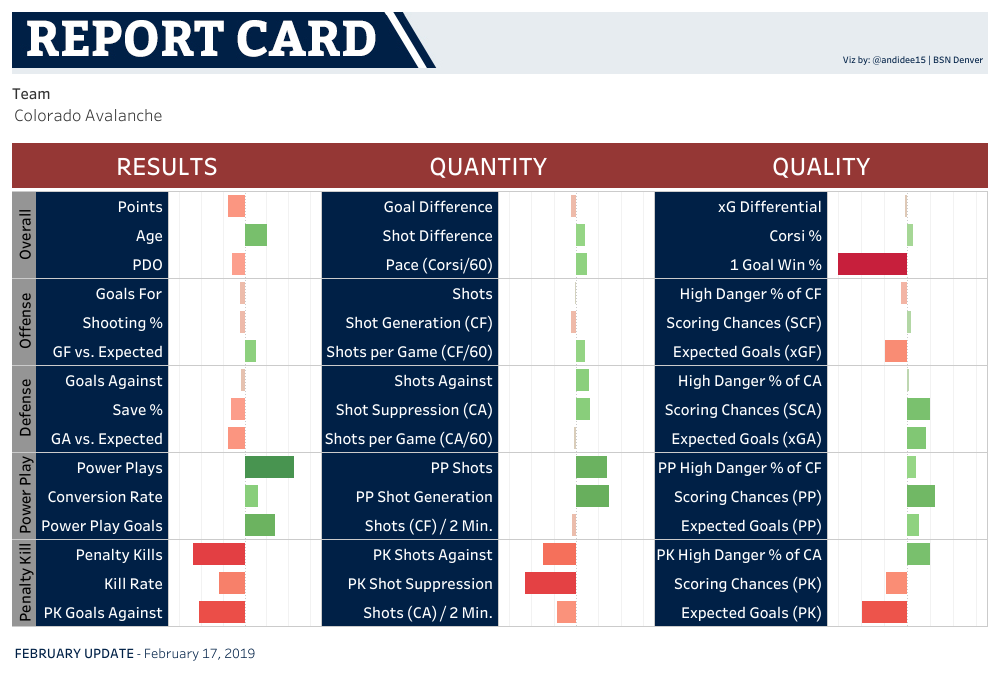 Link to interactive viz
Don't like ads?
Unfortunately, anyone who’s been following the team knows that this season has been anything but average.
The Collapse
The Avs jumped out to an incredibly hot start, and despite a five-game losing streak in early November, they found themselves poised near the top of the league heading into December with a 15-6-5 record. Their 35 points in 26 games placed them on a 110-point pace and ranked an outstanding 4th in the NHL. They had scored 24 more goals than they allowed, and both their top line and their goaltending ranked among the league leaders.
Then December hit. Despite winning two of the first three contests to start the month, the team has stumbled to a 8-17-6 record in the 31 games since. This 58-point pace since the start of December ranks dead last in the league, worse than even the struggling Ottawa Senators. The Avs entered that month challenging for a division lead; now it appears they’ll be lucky if they manage to stop the bleeding long enough to squeak into the postseason.
So what on earth happened? And, more importantly, what does it mean for the Avs over the rest this year, through the trade deadline, and into the critical summer beyond? Can they salvage the season, or do the faults simply run too deep?
The Splits
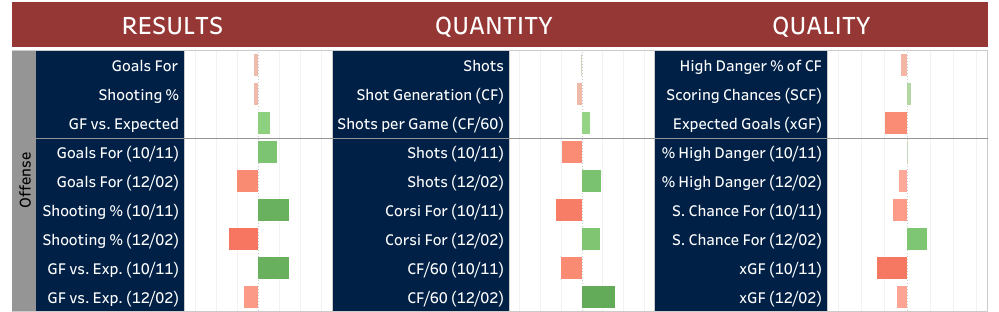
First of all, we need to know what’s really happening. I re-ran the report card from earlier, but grouped it by October/November games – denoted (10/11) – and December through February ones (12/02), which includes up through the St. Louis Blues game from Saturday.
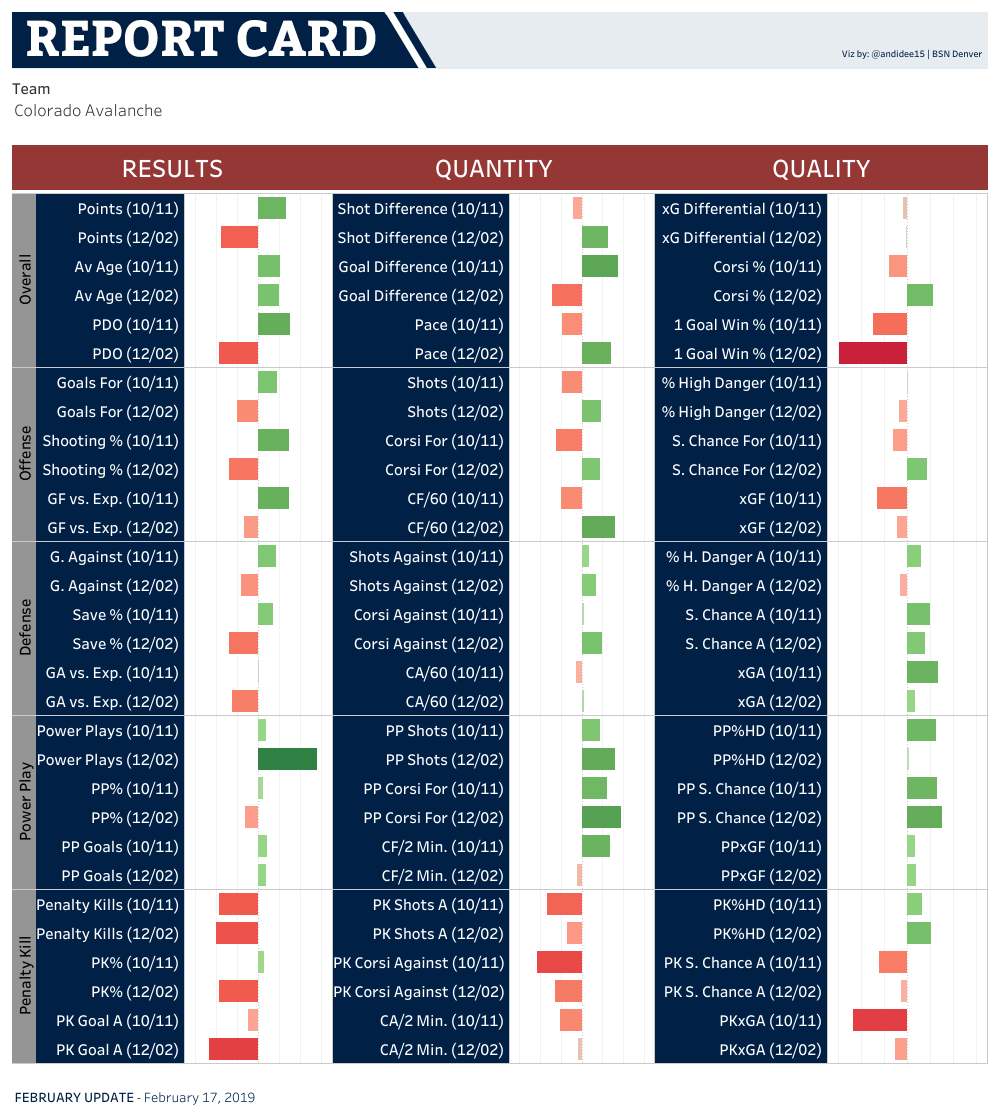
As you can see, there’s a bit more happening here.
Don't like ads?
A quick note on these charts before we start unpacking them – they’re based on league average, and the bars represent the standard deviation away from the mean (math, I know, I know, my apologies). Basically, most teams will fall between the middle and the first light grey vertical line, maybe within the first two. If a bar gets any bigger and brighter, it’s particularly noteworthy.
The fact that this chart looks like a zipper really underscores just how different the two halves of the season have been for the Avs so far.
Overall & Overtime
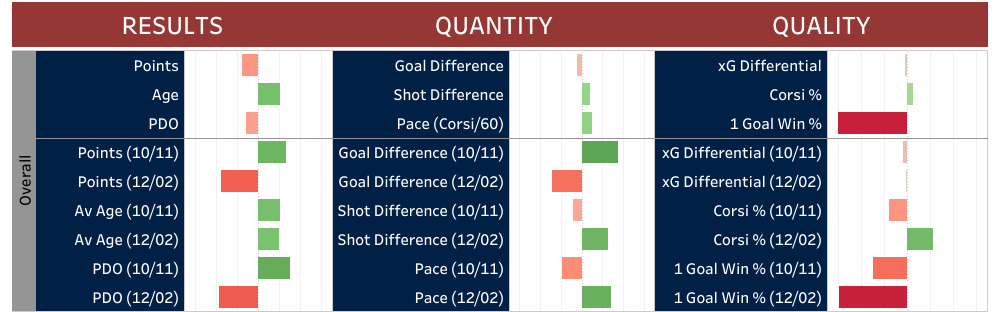
Let’s start with the Overall category. Even though these stats are by far the most important, they usually tell us the least as to what’s really happening with the team. Still, they’re worth mentioning as a benchmark for the analysis to come.
PDO
Perhaps the most interesting number in this group is the team’s PDO, which is a measure of luck or bounces or two statistical categories with a large amount of variance that tend to cancel each other out over a long enough period of time – whatever you want to call it, it’s a team’s save percentage added to their shooting percentage. Anything above 100 indicates a hot streak, anything below 100 is a cold streak, and the closer it is to that mark, the more predictive the rest of your stats will be.
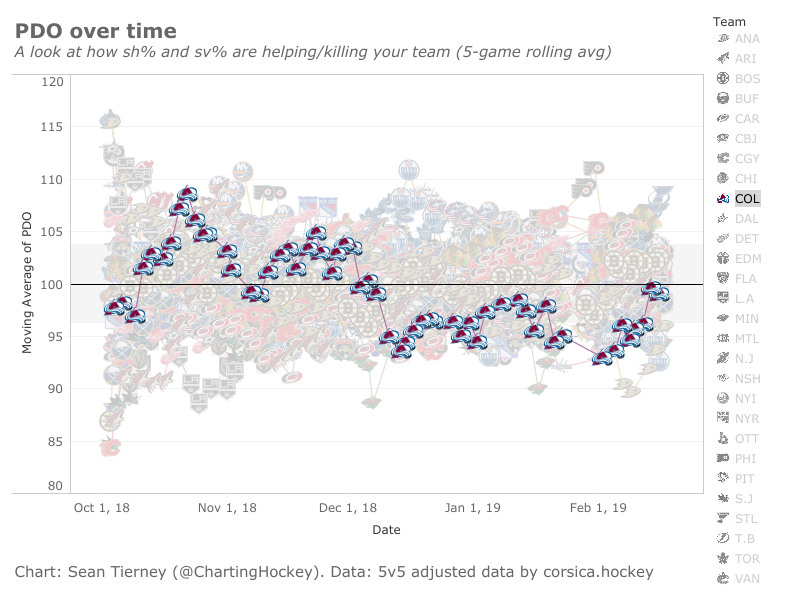
On the season, the Avs PDO is 99.2, but that’s a combination of being at 102.7 earlier in the year and 97.0 since December 1st. In short, they probably weren’t as good as they looked at the beginning of the year, but they probably aren’t as bad as they’ve looked recently. We’ll have to dig deeper to confirm what’s skewing the numbers, but any time you get big bright bars in the PDO category, it’s an automatic warning flag that something is off.
One-Goal Games
The other really interesting stat is their one-goal game win percentage. As the name implies, it looks at the games that end with one goal difference between the teams (say, a 2-3 final score) and figures out the club’s record in those situation.
Don't like ads?
Most of the time, this should be pretty close to .500. Almost always, it’s the little things that impact the final outcome of close games – one team got a good bounce here, one goalie made a big save there. Sure, skill plays into it, but most teams in the league are relatively evenly matched, so it’s largely a coin flip on who scores the tiebreaker in an otherwise tight game, especially if you keep flipping that coin over and over for the extent of a full season.
Unfortunately, that’s not the case for the Avs. They sit dead last in the stat with a 4-6-11 record and .190 win percentage. That’s terrible and highly unexpected.
Granted, this doesn’t take into account empty netters. Once a team gets that coin flip, they’re often able to bump it to a two goal game with a bonus tally. So far this season, the Avs have scored 11 empty netters and allowed 13. If you remove those goals, the Avs have a record of 9-7-11 (.333) in all “close” (one goal and empty net) games, going 5-2-4 (.417) in October/November and 4-5-6 (.267) in December to February. It’s a bit better, but still not great.
In non-close games, the team is 14-17 on the year, with 10 wins/4 losses coming during the first half and 4 wins/13 losses coming since Dec. 1. Add empty net goals back in and look at raw 2+ goal games, the Avs jump to 19-18 and sit at 14th in the league in this category.
Overtime Woes
So why does a decent blowout team struggle so badly with one-goal games? Their record in overtime certainly has a lot to do with it. They’re only 1-11 past the end of regulation, worst in the league by a healthy margin. They’re not great on the road, with 12 shots, one goal, and a shootout loss in seven opportunities for a 1-6 record. Their away overtimes average 3:43 in length, which, despite the losing, is above league average.
At home? Across five games, the Avs have yet to register a shot on goal. All of their overtimes at the Pepsi Center have ended within 1:34, and on average, the Avs don’t even hit the one minute elapsed mark before the other club is celebrating a win.
Don't like ads?
All told, the Avs have played 30:50 of overtime and have managed 12 shots while giving up 32.
What’s causing the problem? Honestly, that’s probably worth a full article of its own. For now, it’s just worth noting that the Avs have been spectacularly bad past regulation this year, both during the first and second half of the season to date.
The other stats in this category will largely be discussed later, so let’s move on to offense.
Even Strength Offense
Even strength offense has been by far the most bizarre area for the Avs this season. When their process and shots generated was below average, they received great results. When they improved their process, they couldn’t score. Logically, this is the exact opposite of what you’d expect, so let’s dive a little deeper to determine if luck or something else is behind these conflicting ideas.
Driving the Play
The first area to look at is score effects. When a team has the lead, especially later in the game, they’re more likely to hold the puck, play it safe, and not shoot as much. At the same time, the losing team is more likely to throw everything on net, trying to get a bounce and equalize the game. It’s why you’ll often see shot shares favoring the loser, even though it doesn’t necessarily mean they played better.
With this in mind, it’s less surprising that the winning Avs shot less while the losing Avs shot more, but there is an extent to which this holds true. That’s why there’s score adjusted Corsi, which weights each shot by the league-average rates for each score situation.
Don't like ads?
So are the Avs’ strong rates from December to present just a byproduct of trailing a bunch?
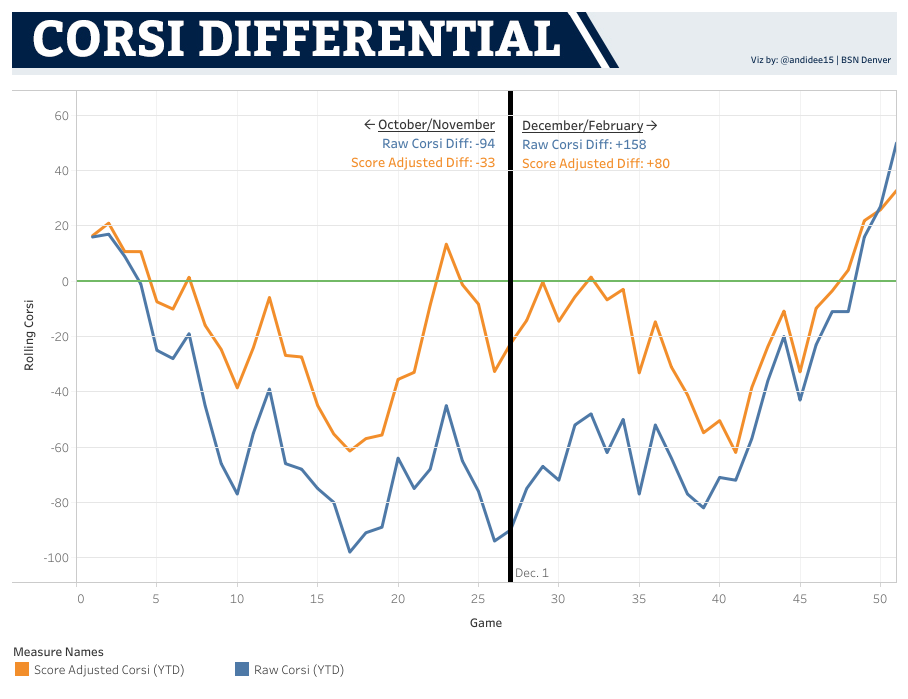
The answer is no. Even though December was rough for their score-adjusted Corsi, they turned on the afterburners at the start of the year and have dominated play in all but the 1/12 game against Montreal. Even when they were trailing, they were dictating the game at a rate well above and beyond what you’d expect from a team in that situation.
Overall, the Avs have a 52.9% shot share since December 1st. That’s the 6th best rate in the league. Their defense over that time hasn’t been anything special – more on that in a bit – but their Corsi For/60 at even strength is 63.8, which is 6.6 more attempts than the average team and the 3rd best rate in the NHL.
On top of that, they haven’t sacrificed much shot quality to do it. Their percentage of shots coming off the rush or around the goalie fell very slightly from 19.5% in the first half of the year to 18.5% since December 1, but in comparison with the rest of the league, that’s an insignificant drop. This isn’t a team just throwing low-danger pucks at the net to boost their Corsi – they’re largely playing the same way they have all year; they’re just shooting the puck A LOT more.
And it’s not just depth players who are doing it.
Individual Contributions
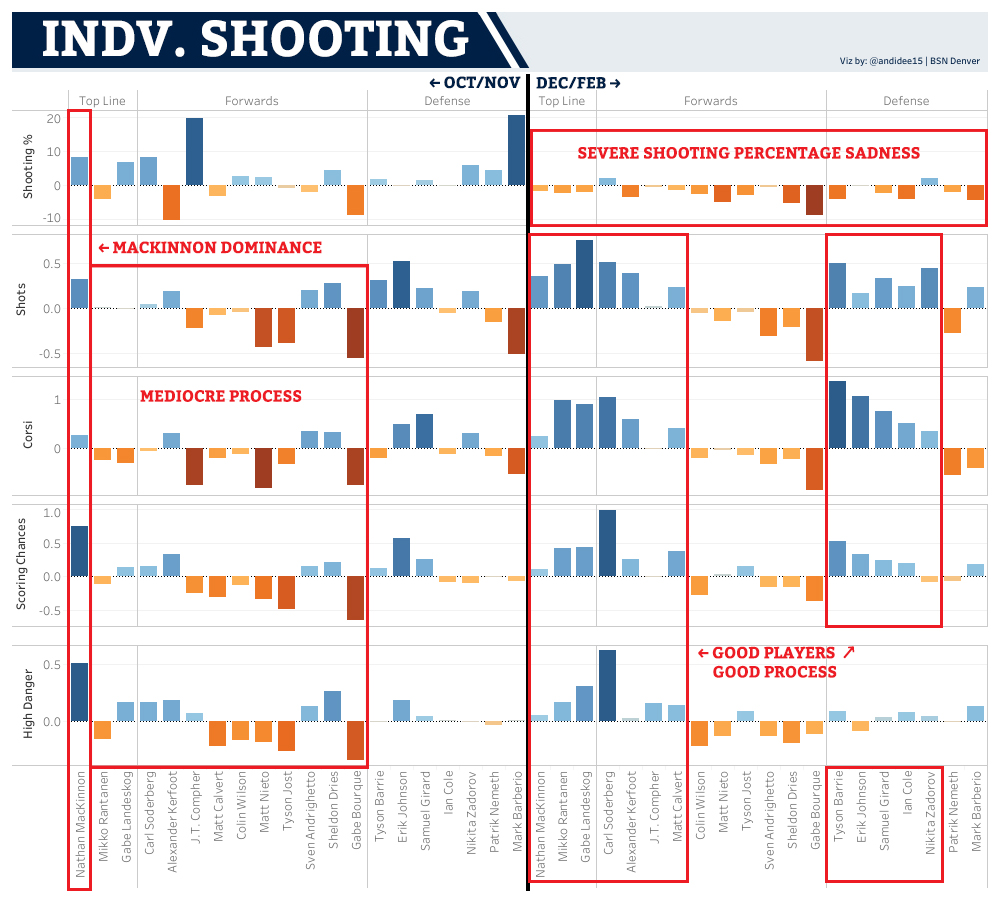
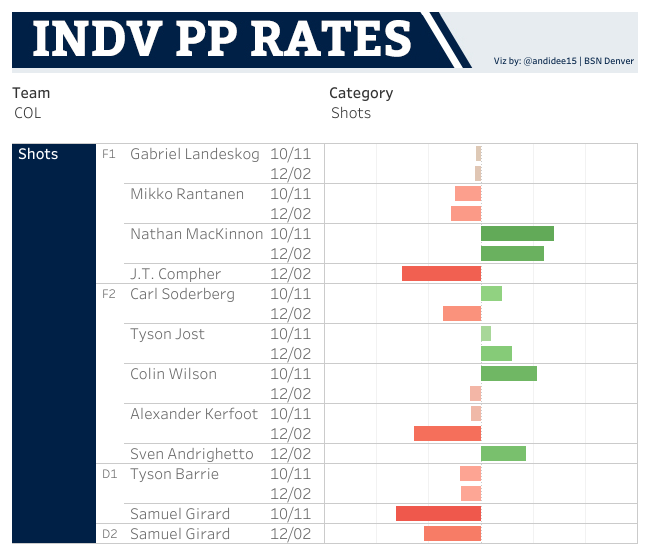
This chart represents shooting percentage and shots per game vs. each player’s career average at even strength.
Don't like ads?
Since December 1, Rantanen, Landeskog, and Soderberg in particular are not only shooting a ton, but generating very high danger chances at a rate that far exceeds anything else they’ve done in their careers. Even Barrie is shooting more and with better quality than usual, but he doesn’t seem to be taking shots away from the forwards – nearly everyone is pitching in more. From nearly all the players that log a significant amount of ice time, their process is extremely sound.
MacKinnon has slipped a bit, especially in comparison to his god mode from earlier in the year. His numbers have actually improved since the start of February and are finally starting to cover for his two pedestrian months leading up to the All-Star break. Even so, he leads the Avs in chances every night; his career average in these stats are quite a bit higher than the rest of these players. It’s frustrating that he’s taken a step back, but he’s still pulling his weight.
So why is scoring down? It’s not because bad shooters are taking low percentage shots. Apart from Soderberg and Zadorov, to a man, every single one of the Avs are well below their career shooting numbers. They’re doing everything they can to score; the pucks just aren’t going in.
The Missing Goals
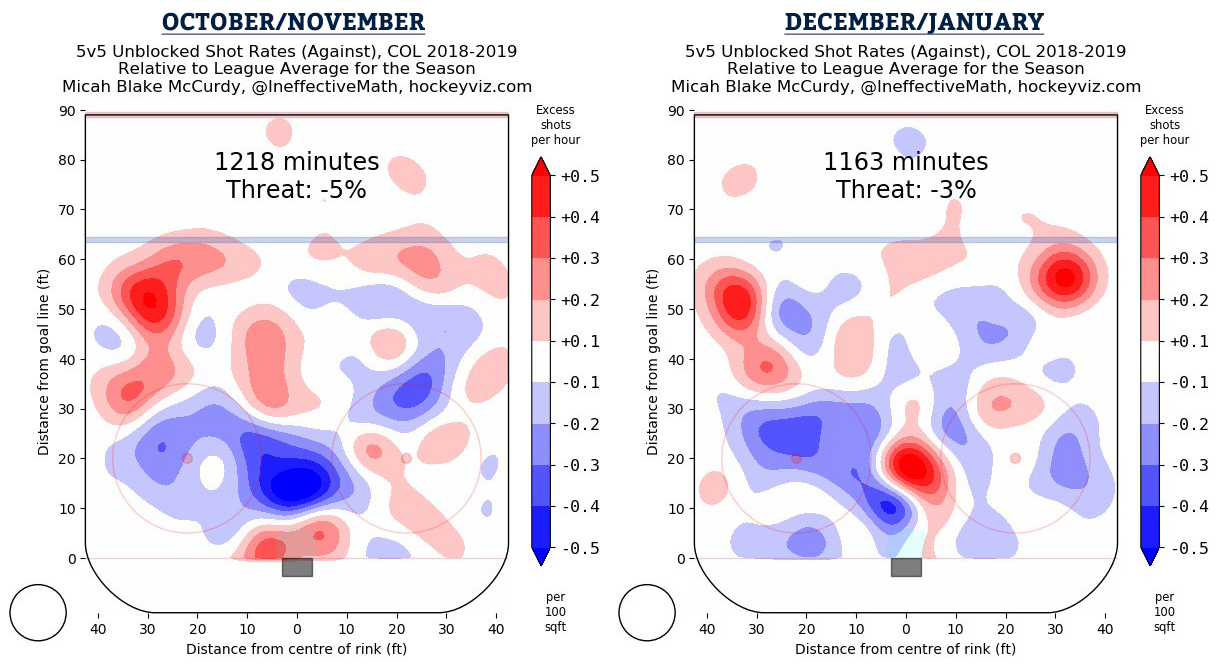
The Avs are in an offensive slump, there’s no doubt about that. And the heatmaps back it up.
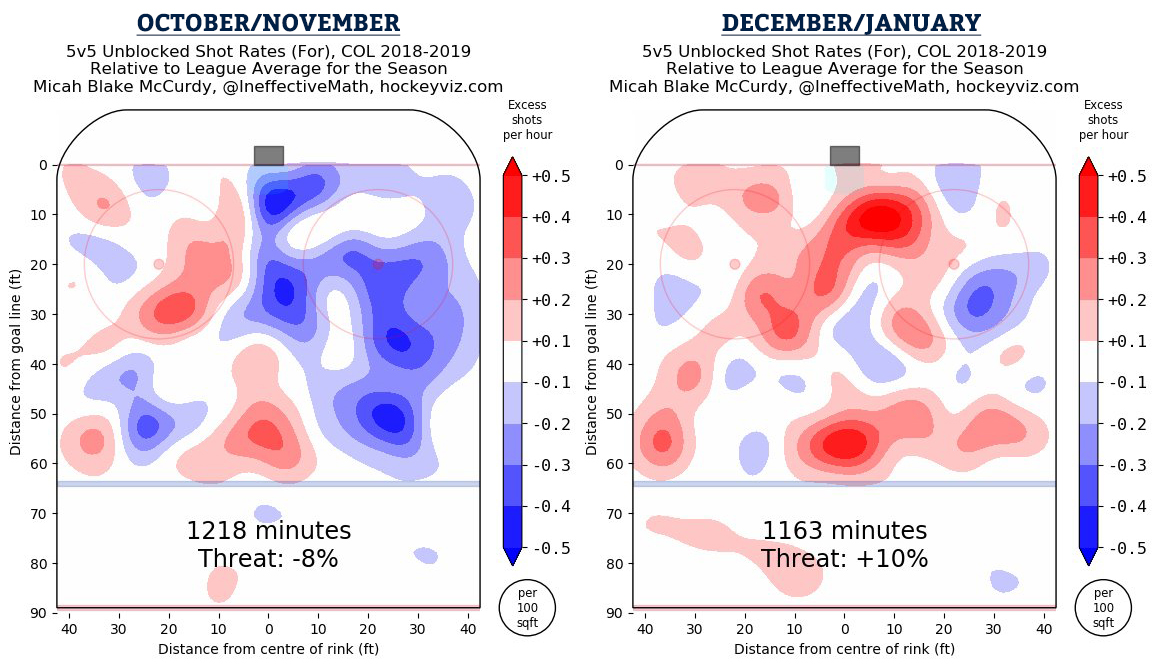
The team on the left scored 2.3 goals per game at 5v5. The team on the right – the one with the gigantic hot spot right on the goalie’s doorstep and very little blue anywhere – is only receiving 1.6. For reference, the league average is at 2.1 goals per game.
It’s not just depth scoring taking a hit. The top line generated 23 goals at 5v5 in 26 games (.88 goals per game) before December 1 while shooting at 14.4%. Since that mark, they’ve only posted 18 goals in 32 games (.56 goals per game) at a 7.6% rate. Depth scoring contributed 36 goals at 5v5 before Dec 1 (1.38 goals per game, 5.5% shooting) and 34 goals to date (1.06 goals per game, 5.7% shooting).
Don't like ads?
Overall, the team shooting percentage was a sad 6.24% at 5v5 in December through February. That’s good for only 52 goals despite 833 shots.
If you take the career shooting percentage of everyone on the team (7.5%), they should have 63 goals (1.95 goals per game) in that time. If you take the league average rate (8.2%) which accounts for the higher scoring this year, they’d have 68 goals (2.14 goals per game). And considering how their offense is +10% more threatening than the NHL average, it’s not unreasonable that they should have more than that. For reference, Tampa Bay (who is leading in even strength scoring at 2.5 goals per game) is at +11% on the year.
In short, 52 goals is a little different than 68, and that 16 goal difference is spread over only 32 games. What’s worse is that the leading cause appears to be pure, dumb, bad luck.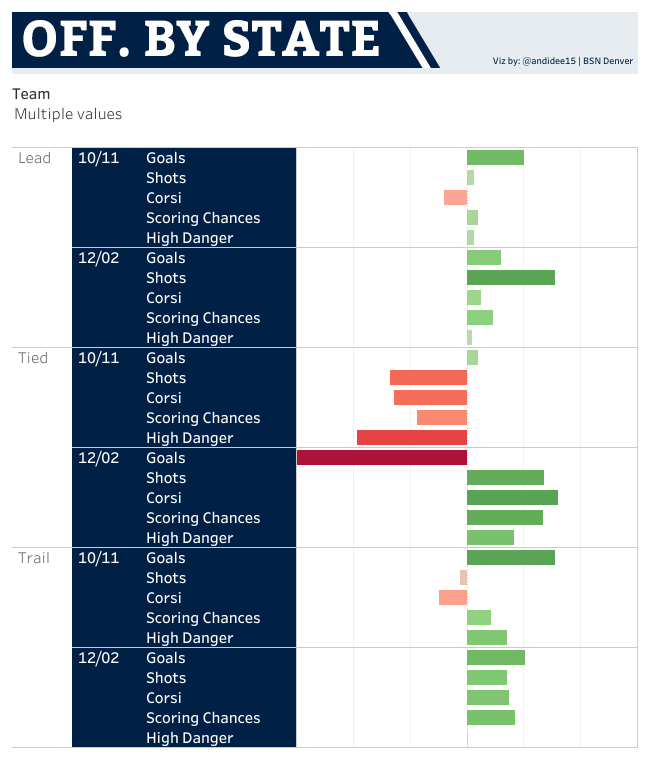
The Avs’ process since December 1st is in the green no matter what the score state happens to be. They keep driving the play at a decent level when ahead, they put up a strong fight when they’re behind, and they’re dominant vs. the NHL average when the score is tied.
Despite all that excellent process, they’ve only scored 12 goals when the score is even. As you may have noticed from the red bar that decided to dive its way off the chart, that’s a little lower than expected. As such, there’s a very good chance that those 16 goals the Avs are “short” would mostly be first goals of the game or go ahead tallies, which also happen to be the goals that most drastically alter the courses of contests.
Conclusion
The Avs can’t control their shooting percentage. They can control their process, and it’s been shockingly exceptional for the past two months. Sooner or later the dam will break, and there are signs it’s turning already. Sure, getting better players at the deadline could help, but more than anything, the Avs just need some bounces.
Don't like ads?
Even Strength Defense
On defense, there’s one area that stands out right away: the save percentage from December/February. We’re going to ignore that elephant for one minute and focus on the process in front of the goaltender.
An Unusual Comparable
To start things off, let’s play a game. In keeping with the Tampa Bay comparison from earlier, one of these teams is Tampa’s defense to date; the other is the Avs since December 1.
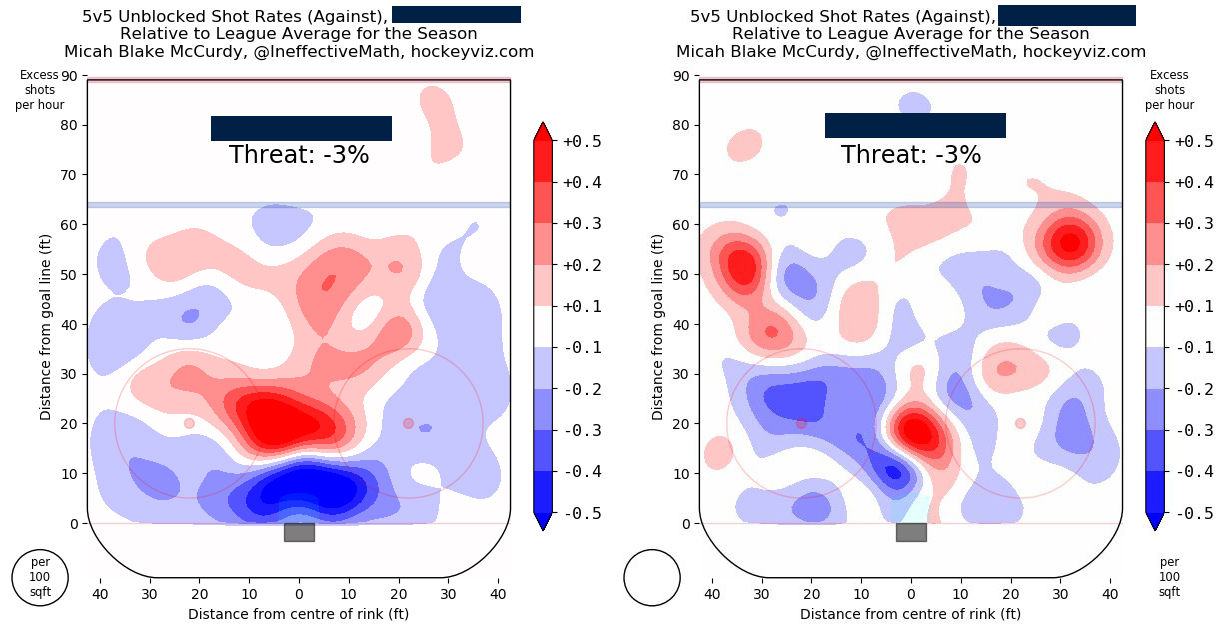
If you guessed the one with the bigger red blob in the dangerous slot area (left) was the Avs…. you’d be wrong.
There’s been a lot made of the Avs D on social media lately, and there’s no denying that there have been some really terrible decisions made around the goaltender. It’s also clear that the Avs’ defense has gotten worse since the beginning of the season, particularly at defending shots from the slot area.
But what exactly is happening? What’s driving these changes, and is it happening uniformly?
Highway to the Danger Zone
Don't like ads?
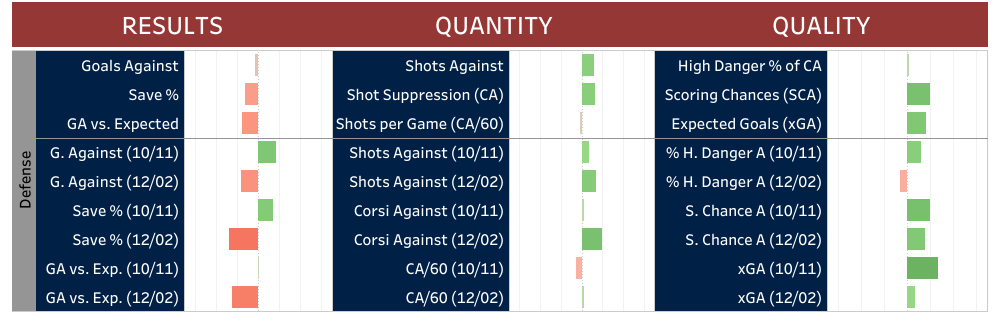
To start, let’s take a deeper look at where the Avs are allowing their shots and how the distribution has changed.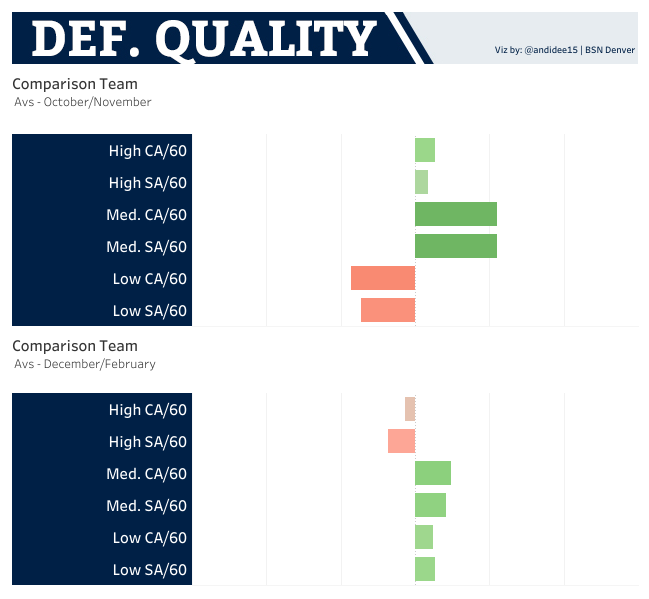
Sure enough, the Avs went from above average to below average in the high danger shots category before and after Dec. 1. They also took a step back preventing medium danger chances, but have done a much better job of limiting low danger opportunities.
Overall, this is the opposite of what you’d like to see, even though it lines up well with the heat maps posted above.
It’s a disappointment, but it’s still not terribly out of whack with league averages. What is out of whack is when it’s happening.
Score State Struggles
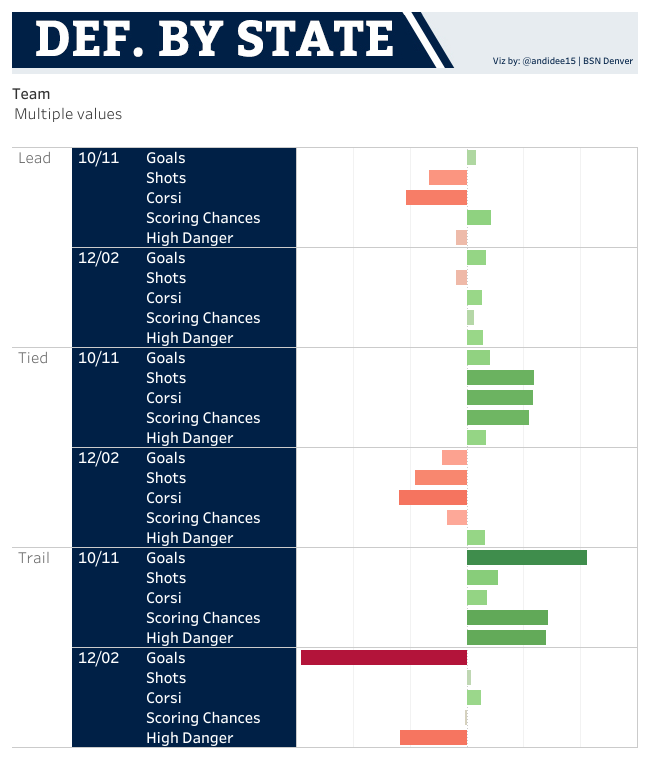
The biggest red flag is the cluster of five bars at the bottom of the graph. It represents the shot rates during this slump while the Avs are trailing. This chart includes February and doesn’t look so bad – there’s some high danger issues, but overall, the Avs’ D has been largely league average when trailing.
Compare that to a chart that only covers December and January, which comprised the true heart of this slump.
Don't like ads?
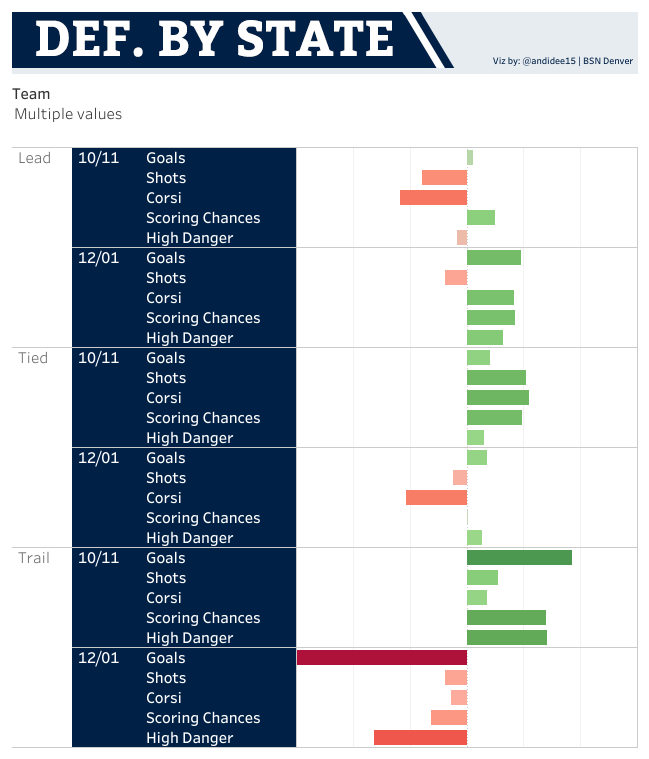
Unlike earlier in the season when the Avs locked down defensively if they fell behind, they played catastrophically terrible hockey for two straight months. The vast majority of the dip in high danger chances came during this score-state alone.
While it appears that the February Avs have recovered from their defensive collapses to some extent, their process while leading and tied has now taken a step back. During the majority of the slump, they were very good at gearing down and preventing the other team from getting back in the game once they grabbed a rare lead. After a few bad games, that’s slipped to league average. Not the end of the world, but something to keep an eye on.
Conclusion
So what does all this mean? Talent-wise, the Avs are a decent defensive team with flashes of something more. It’s still not perfect, but decent is a huge improvement from even last year, let alone two seasons ago. Unfortunately, the December and January Avs typically panicked and collapsed when they gave up a goal. The rest of their strong play went out the window and they resorted to tense, bad-decision hockey.
The good news is that it’s a localized issue. The better news is that it’s already showing signs of clearing. But the bad news is that there’s still a gigantic red bar in the goals against category without a clear cause and definite cause.
And that’s where the goalies come in.
Even Strength Goaltending
If you’re wondering why the Avs have been losing, spoiler alert: it’s the goalies. But before we get too far into why that’s the case, it’s worth taking a moment to talk about how goalies and defenses are intertwined.
Don't like ads?
Methods for Evaluating Goalies
There’s no doubt that the number of shots and the quality of shots are going to have an impact on how many goals the tender lets in. So how do we separate out this influence?
For one, we look at save percentages instead of raw goals. If a goalie makes 9 saves on 10 shots, they end up with the same save percentage as one that makes 90 saves on 100 shots. Sure, one tender gives up 1 goal while the other gives up 10, but their .900 save percentage describes how they performed on their own, separate from their defense.
The other way to minimize the impact of defense is to look at save percentage for high, medium, and low danger bins separately. Goalies tend to have a harder time saving shots that come from close distances, so if that’s mostly what they’re facing, of course their overall save percentage is going to look terrible. But by splitting it up and using average save percentages based on the danger bin, you can get a decent idea how the goalie is performing on a more granular level.
This means that even though the Avs D has struggled while trailing since Dec 1, but that doesn’t necessarily mean the goaltending has to be as well. If they are, there are two separate problems at play.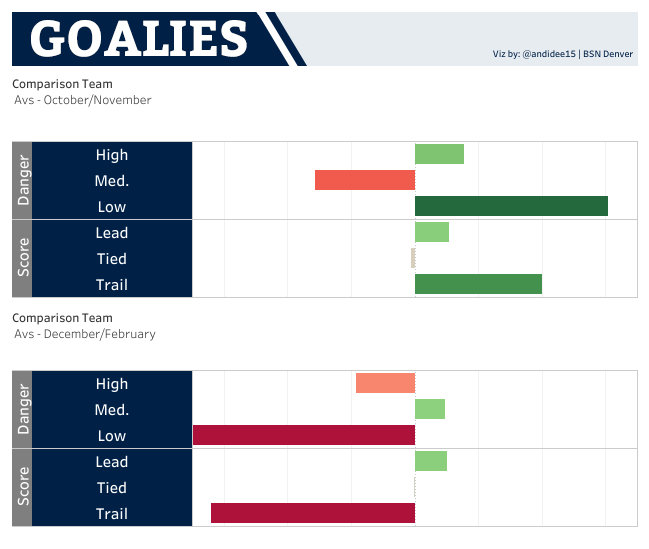 Link to viz
Clearly, there are two separate problems at play.
Don't like ads?
Coffin Nails
During the slump, the Avs goalies have actually been slightly above to right at average at stopping pucks when the team is tied or leading. But once one goal goes in, watch out.
Most notably, the team went from having the second best low danger save percentage in the first half at 98.9% to second worst at 94.2%. This may not seem like much, but over 328 low danger shots since December, that’s the difference between 4 goals and 19.
This is of course an extreme case, but if you calculate league-average goaltending across all the shots in each of the bins during the slump, the Avs tenders allowed 11 extra goals versus this average in 32 games. Most of these came when the team was trying to get back into games as well, so calling them “coffin nails” seems appropriate.
The numbers get even worse as you get more detailed.
Expected Goals Against
Evolving Hockey’s expected goals (xGA) model looks at multiple variables for each shot, compares them to similar shots, and finds the likelihood that they become goals. Using this metric, the Avs were the 7th best team in the league at preventing quality and quantity over December/February. This is down from 4th earlier in the year, but still a stout number all things considered.
It should be noted that the calculations for it are based on the past few years of scoring, so the uptick in tallies this season may have thrown it off slightly in comparison to actual goals scored. But even with that grain of salt, the number of goals the Avs goaltenders have allowed is 23 under “expected” in only 32 games. If that’s even close to true, that’s a horrific number.
Don't like ads?
Compare this to earlier in the season where the goals saved vs expected were about equal. Even if the team fell behind, their goalies stepped up and kept them in the game. High save percentages like that tend to correct back towards average slowly over time, but dramatic swings like we’re seeing right now are not normal or predictable. It’s also unusual to see them in only one score state.
The Avs have trailed a lot during that time too, so there were probably some goals that were just great shots that happened regardless of score state. But the team was tied or leading for 201 more minutes than they were behind, so the variance is probably not strictly time or opportunity related.
Overall, truly bad goalies tend to be bad a little more uniformly than this.
Conclusion
So why have the goalies been struggling so much lately?
There isn’t a clean statistical answer. Based on watching the games and studying these numbers, it appears that there may have been a string of bad bounce goals against the team in December. Instead of locking it down like they had been, the goalies began to panic after they let in a goal, leading to more goals scored in quick succession.
The defense picked up on this, leading to their tense, desperate, “don’t allow any shots”, and “don’t lose” play. This in turn drove their otherwise adequate defense down during these situations, leading to even more goals against.
Don't like ads?
In short, I think it’s a mentality and confidence problem. This is a fragile team. For the bulk of the minutes of this season, they’ve shown average to above average overall play, so this isn’t a talent issue like we’ve seen in the past. Their stats collapse in one very specific situation: when they fall behind in a game.
On the same token, I also believe the goalies can drag the team out of this mess. You saw it with Varlamov against Winnipeg – he let in a shaky goal and the defense collapsed, but he fought through, the team recovered, and they closed out the game playing the confident, strong, lock-down hockey they’re capable of while leading.
There’s a trust issue that’s opened up between the goalies and the defense, and it should be as quickly closed if these goalies return to their career averages. It does require the goalies to weather complete defensive collapses for multiple minutes inside a season where they too have struggled with confidence, but that is the only realistic way to pull out of this tail spin before the end of the year.
Power Play
Let’s now shift gears into special teams, starting with the power play.
A (Not So) Powerful Play
Over the course of the full season, the power play has seemingly been the one bright spot for the Avs. They currently rank 8th in the league, and it’s green across the board. So, this is not a problem and we should just move on, right?
Don't like ads?
Not exactly.
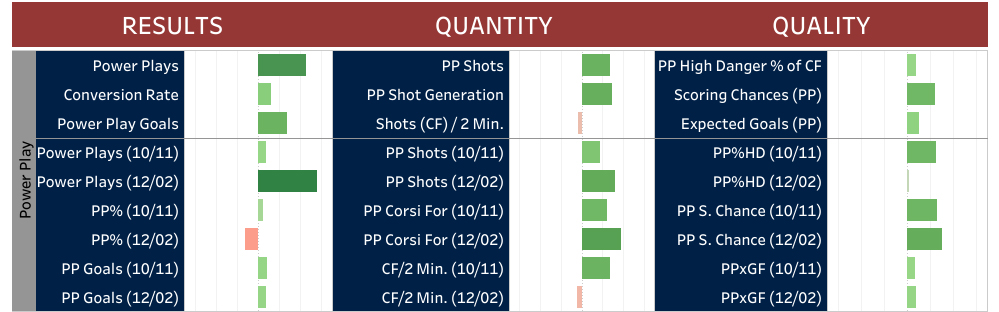
The power play is arguably the weakest system the Avs have going right now, and it’s only gotten worse since the beginning of the year.
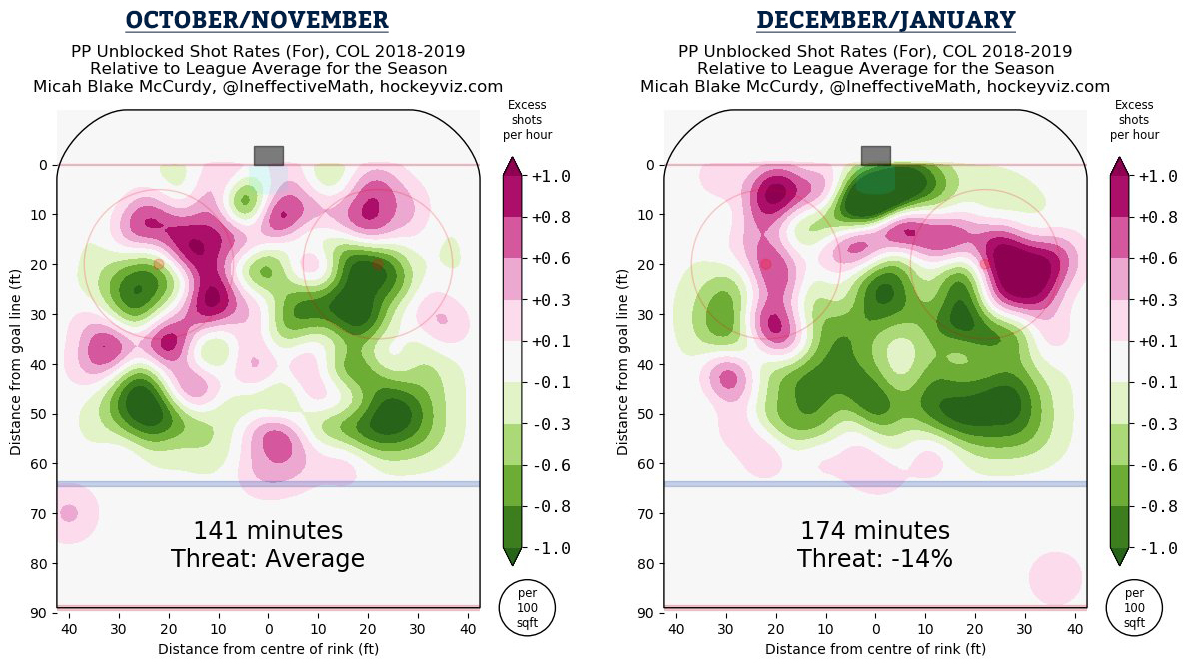
Earlier in the season, the power play was generating a decent number of shots and dangerous chances. The team was utilizing their forwards in the slot area, and the defensemen were firing the puck from the top of the formation at an above average pace. MacKinnon in particular carried a ton of the shooting load from the left side, but cross ice passes were finding Mikko Rantanen at the low side of the right circle.
That’s not to say it was spectacular. The shooting rate and high danger chances were respectable, and the overall rate of shot attempts and scoring chances were slightly above average. But what really carried the power play to great success was a bloated shooting percentage.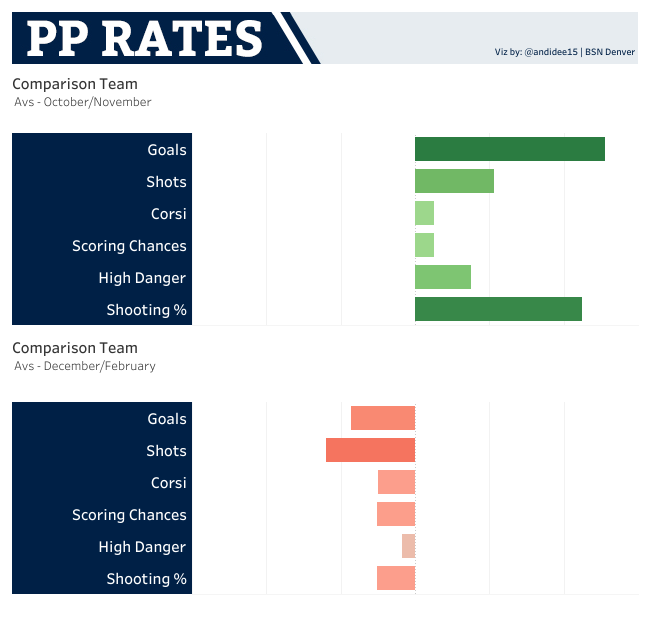
That’s not a bad thing, but predictably, that started to dry up through December and January. What’s more concerning is the fact everything else did too.
Individual Contributions
There’s no doubt MacKinnon is still the man on the Avs’ power play. He’s consistently top 10 in the league when it comes to shots on the man advantage, and he hasn’t disappointed this year. What has been slightly disappointing is the fact he shot 12.8% in Oct/Nov and 8.0% in Dec/Feb and only has 7 tallies on the year. The average shooting percentage for a top unit forward is 15.8%.
Landeskog has 10 goals; Rantanen 11. Both are producing shots at a below average rate, as is the last forward of that unit, JT Compher. Tyson Jost and Sam Girard have improved from the first half to the second, but everyone else has followed the lead of the top unit and taken a step back.
Don't like ads?
One of the leading theories on why the Avs are struggling to score on the PP is that Tyson Barrie is taking too many shots. While that still might be the case, he’s shooting at a rate that’s below average for a top power play defenseman. His shot rate has held steady since the beginning of the year, and his rate of shot attempts (including misses & blocks) has slightly fallen.
Overall, the Avs run a very top unit heavy split, and MacKinnon, Rantanen, and Barrie have been playing a lot of perimeter hockey. It’s not that Barrie is necessarily shooting more and taking those opportunities away from MacKinnon and Rantanen; it’s that everyone is shooting less, especially the two players in the slot that never seem to touch the puck.
The Broken System
The Avs current power play setup has taken what should be a 5v4 advantage and turned it into a 3v4. Sure, they get a little help from the other two mucking out the puck out from behind the net or with the occasional deflection, but throughout the entire year, the team hasn’t been utilizing that net front presence much at all.
The top unit is still talented enough to score on occasion, but the second unit has suffered. And it’s not just the Avs feeling the pain: the Avs top affiliate, the Colorado Eagles of the AHL, run the same system and are 29th of 31 on the power play due to many of the same issues.
It’s not a system that’s designed for ugly goals. There might be the odd deflection or rebound, but it’s catered to a level of blueliner shooting and top forward sniping that this organization largely lacks. As the shooting percentage dried up for the second unit players in particular, it’s been exposed as a very mediocre system.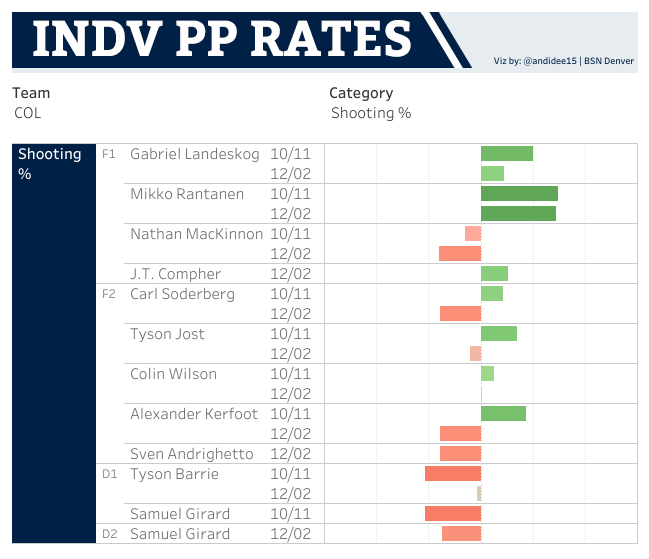
As a result, the Avs power play conversion was 21st at 16% during December/February (league average: 19%) while scoring 20 goals (average: 18). You may note that their goal scoring is above average while their PP rate is below; that’s because they lead the league with 124 opportunities. The next highest team, Carolina, only had 117.
Don't like ads?
Conclusion
So why do the Avs rank still rank so high on the power play? It’s a combination of a holdover of early season bliss and a brute force attack based on getting more chances than everyone else.
This is an area where the coaches – Avs assistant coach Ray Bennett in particular – have the power to make some meaningful changes to improve results. While it’s unlikely the team does so in the short amount of season remaining, it’s something they need to address over the summer months in preparation for next year.
Penalty Kill
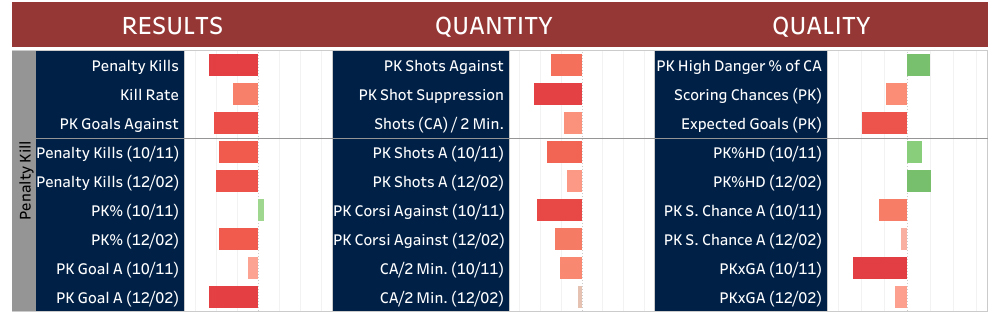
Now it’s worth addressing the flip-side of special teams: the penalty kill. As you can see from the chart above, the Avs have had a bit of a rough go on the man disadvantage this season.
But just like the power play, the big picture stats only tells part of the story.
Parades to the Box
The largest culprit behind these numbers is the fact the Avs sit 31st in overall infractions on the year. Since December 1, they’ve had 110 shorthanded situations, narrowly edging out Carolina’s 108 for the dubious distinction of the most penalized team in the NHL.
Don't like ads?
Now, they’re a fast young team that’s had the puck in their own zone quite a bit, especially during this slump. They’ve drawn a lot of penalties themselves. Even if you go down the conspiracy theory rabbit hole and attribute some of these calls to the refs wanting to “make things even”, there’s still no doubt that the Avs have taken more than their fair share of lazy, undisciplined penalties.
Whatever the case, putting your team at this much of a disadvantage this consistently is a huge problem, even under the best of circumstances.
And the Avs PK this season has been anything but.
Royal Roads and Seas of Green
Let’s start with the heat maps.
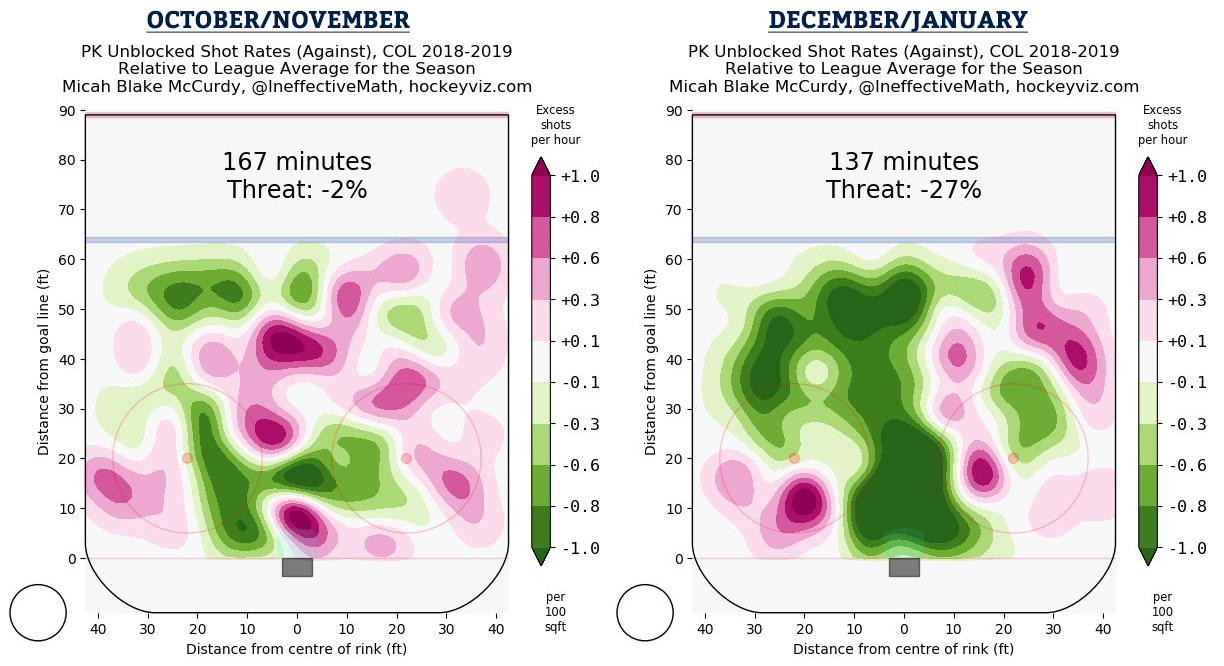
Early in the season, the Avs were still finding their process. The hot and cold spots showed up without too much rhyme or reason all over the zone, leading to a fairly average penalty kill. However, starting in December, the middle of the ice became a tranquil sea of low shot rate green. The Avs really locked down defensively with only a couple problem areas remaining.
Don't like ads?
One of those areas happens to be shots from the point, especially the on the right. The other issue comes from near to below both faceoff dots.
If that seems like a familiar area – it should. Those spots are often indicative of the cross-ice passes MacKinnon and Rantanen have been slinging on the Avs’ power play all year. These “royal road” passes are exceptionally difficult for goalies to stop since they require lunging from one post to another before the sniper receiving the pass can tuck it home. And as MacKinnon and Rantanen have shown repeatedly, that’s a very, very tall order for any goaltender in the NHL.
The rate-based stats support these conclusions as well. The team was fairly unimpressive to start the year process-wise, but they still were able to kill penalties due to a bit of good goaltending. Since then, their kills have truly stifled opposition’s offensive process.
But the goaltending? Well….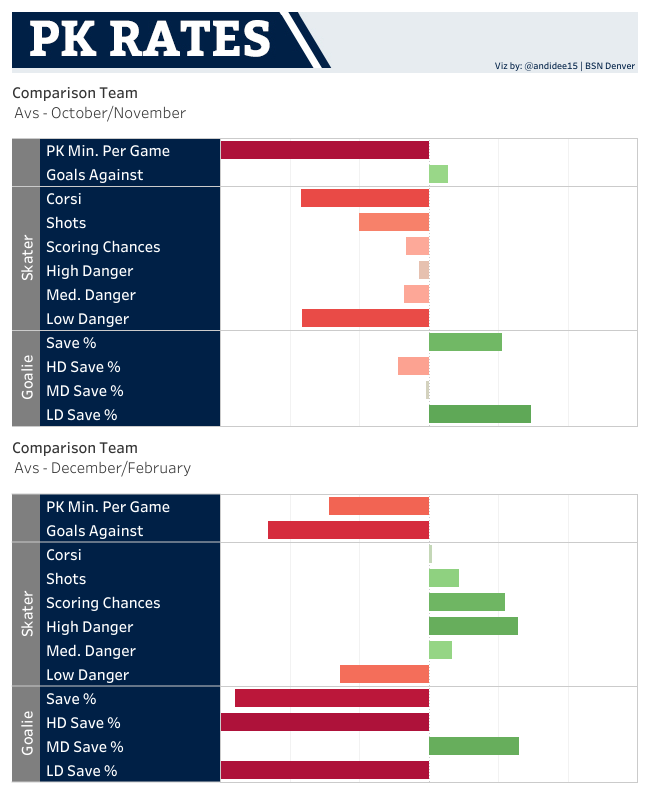
Those save percentage bars since December… that’s not great. Not great at all.
Penalty Kill Goaltending
To be fair, a large part of the high danger save percentage plunge is understandable. The Avs skaters are locking down almost all chances around the net – they’ve only allowed 35 shots in 32 games – but if many of those shots are the royal road passes mentioned earlier, the goalies never really had much of a chance.
Don't like ads?
Of course you’d like to see the tenders stop more than 1 in 3 shots (they’ve given up 12 high danger goals; league average would be closer to 7), but the defense in front of them shoulders a fair amount of blame as well.
But the low danger shots? Now those are the true backbreakers.
Early in the season, Head Coach Jared Bednar was asked about his penalty kill systems. He went into detail about how the team looked at their goalie’s histories and which shots they’d traditionally stopped well. The staff then specifically designed their system around allowing those looks so the goalies would know what shots to expect and the defense could focus on shutting down everything else.
During October and November, the strategy worked well. The team allowed a ton of low danger attempts, but the goalies ranked in the top 5 in low danger save percentage. The combination was effective and the Avs ranked 11th overall in their ability to kill penalties.
Since then? The team’s save percentage in this category has tanked from 96.2% to 81.9%. Not only does this represent the worst rate since December 1st by a country mile, it’s nearly 10% below the league average of 91.7%. If the Avs goalies had saved an average rate of shots during that time, they would have allowed 6 tallies. Instead, they allowed 13.
Conclusion
The Avs penalty kill is a tough one to place. On one hand, the skaters are playing their system almost to a T since December 1. The majority of the shots are coming from exactly where they’re designed to be coming from. There are still some breakdowns, but their rates are downright great in comparison to the rest of the league.
Don't like ads?
However, the goaltending has been horrific. Perhaps the goalies need more shots to feel engaged – Varlamov in particular has played very well throughout his career when facing a high volume of chances – but whatever the case, they’ve completely broken down in the one area where they’re relied upon the most.
In comparison to league average, the Avs PK has let in around 10 more goals than expected during this time. In a 32 game period, that’s a lot on their own, but what’s worse is a number of those broke ties. As mentioned above, the Avs’ even strength collapses occurred after goals against, and those tallies weren’t limited to even strength. More than once, unsuccessful kills had a chain-reaction affect on the rest of the game.
Wrapping It Up
So why have the Avs been losing? In order of importance:
- They can’t buy a goal when they’re tied
- Goaltenders (and sometimes skaters) mentally collapsed after letting in a goal against
- Their results in overtime are terrible
- They take too many penalties
- The penalty kill goaltending is unexpectedly short circuiting the system (or the system is unexpectedly short circuiting the goaltending – either way, something is broken)
- The power play is inefficient at best, ineffective at worst
- The team needs more skill and finishing ability than the current depth forwards can provide
It’s quite the list, spanning across all facets of the Avs’ game. Everyone from the players to the coaches to the front office deserve a little blame, which is expected after a 8-17-6 run.
Collapse Comparisons
Unfortunately, this isn’t the first collapse the Avs have seen in recent years. Even within the past decade, the team has experienced catastrophic season failures in ’08-09, ’10-11, ’13, and ’16-17. It’s an ongoing and disheartening trend, so the desire to just toss this one onto the heap as another one of “those seasons” is very understandable.
Yet one glaring difference separates this campaign from the rest: none of those other seasons had problems so specific.
Don't like ads?
Instead of “the Avs have a terrible offensive process, a shockingly bad defensive process, and aren’t getting the goaltending to cover it up anymore”, we’re talking about a handful of goals for and against in individual score states and localized shot locations because everything else is in the green.
Instead of “I’m not even sure what the Avs systems are because they’re being executed so poorly”, we’re discussing the pros and cons of the defined roles of the power play and whether or not a single passing play is damaging the penalty kill.
Instead of “the Avs critically lack high end talent at nearly all positions”, we’re watching a roster that has a top line that sits among the league scoring leaders, a defense that has played at league average or better for the vast majority of the year, and a prospect system that boasts likely two more top five talents who could realistically join the lineup within a matter of months.
Yes, the lack of a defined second line has caused problems, and yes, the struggles experienced by the young players have been disappointing to watch. Without their steps forward, the Avs have too many third and fourth line players on the roster right now. It’s not ideal; but in comparison to the other collapse years, the fact that the Avs are rolling out legitimate NHL talent on all four lines nearly every night is a clear and drastic improvement.
There’s no doubt that the goaltenders have also been a problem, but they’re inexplicably far, far below their career averages. Avs GM Joe Sakic recently went on the record stating that the team has two good goalies that lost confidence during the slide. Given the way they played prior to December and while tied or leading since, that’s not just PR spin. The numbers largely back up this statement as well.
The issues aren’t minor – no problems that cause a slump of this magnitude are. But this is an entirely different beast than we’ve seen before. This isn’t just another lost season, another one for the pile. The results may not be there yet, but this team is still laying down some very good habits at a very fast rate.
Don't like ads?
For once, the issues aren’t catastrophic failures.
They’re growing pains.
Salvaging the Season
So where do we go from here? What does the rest of the season start to look like?
Honestly, it’s hard to say. So many of these issues aren’t based on a lack of talent. There’s no deadline deal that can come in and magically cure this roster, mostly because this roster’s issues are largely within their own heads.
When they can’t score first, the goaltending is under pressure to be perfect. When the goalie lets one in, both the goalie and skaters feel the intense pressure to not let in another. Everything went cold at the same time, and the issues that cropped up fed into each other and snowballed out of control. The bulk of their play during a game is fine, but under certain situations, they become tense, nervous, and prone to uncharacteristically poor decisions and plays.
But you know what? This is a young team. This is what young teams do. It’s not special or unusual or out of the norm – it’s just part of the process. And as long as the Avs keep improving, this season will end up a big ol’ bump on a much longer road.
Due to the West struggling just as much as the Avs right now, they’re still very much within the playoff picture. If they find a way to emerge from this malaise – which has the potential to end dramatically at any time – the wild card spots are there for the taking.
Don't like ads?
Perhaps a big trade would be enough of a shakeup to snap them out of the funk. Varlamov’s play has already seemingly turned a corner; it’s possible the rest of the team will follow soon as well. Bednar’s recent scrambling of the lines seems to have loosened the skaters up a bit, so with any luck, their play continues to rebound.
But even it doesn’t, the issues plaguing the Avs can mostly be cured with a few weeks on the beach and some rounds of golf. A total mental reset will do them more good than anything. The perfect storm of situations that caused this season to derail is very unlikely to hit again, so once you add in a good UFA class, a couple high first round picks, and a few expected trades, their fortunes could turn rather quickly.
The lack of results is undeniably frustrating, but it’d be a mistake to let these issues overshadow all the growth this team has made. Whether the postseason is in the cards for the roster or not, if they keep at this, better days are almost certainly ahead.
Comments
Share your thoughts
Join the conversation
The Comment section is only for diehard members
Scroll to next article
Don't like ads?
Don't like ads?