© 2025 ALLCITY Network Inc.
All rights reserved.

The Colorado Avalanche open their Quest for the Asterisk this afternoon against the surprising Arizona Coyotes. The Avs are considered heavy favorites and sit as the odds-on favorites to win the Stanley Cup based on the betting lines.
We’ve talked about Arizona a bit as a team led by elite goaltending from Darcy Kuemper but before the puck even reaches the goaltender, a whole lot of hockey has to take place.
As the resident numbers nerd around here, I figured we’d take a more analytical look at who these teams are coming into the series. The data I’m using is strictly from the regular season and not the Qualifying Round or Round Robin stages as I’m going with the larger sample size as more representative of who these teams actually are.
Let’s begin with some heat maps. As a reminder, plus percentages are good on offense, negative percentages are good on defense.
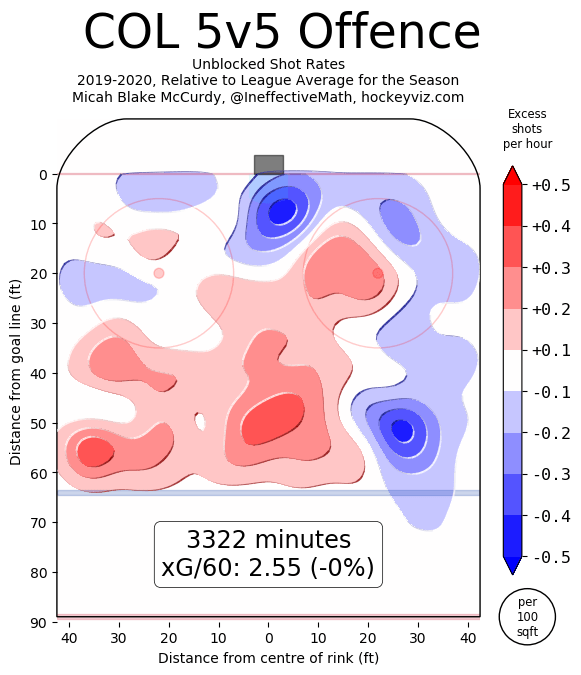
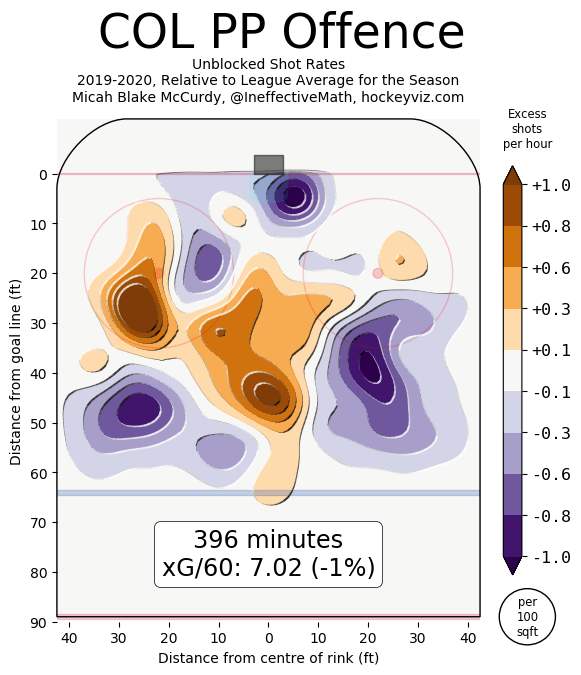
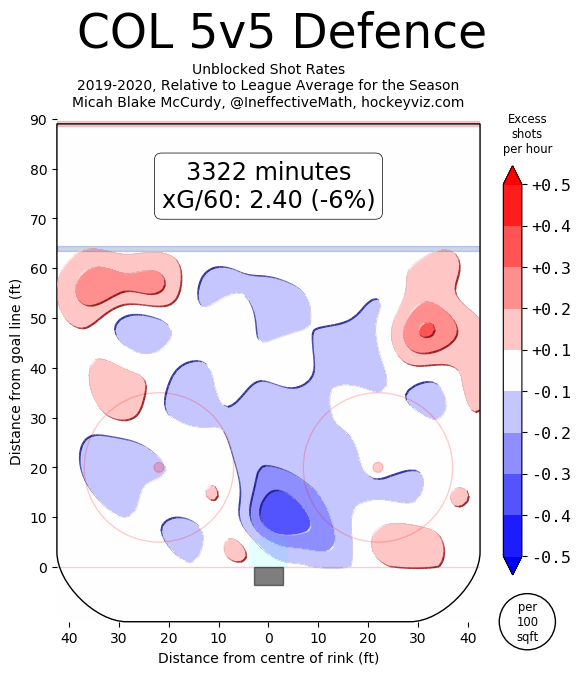
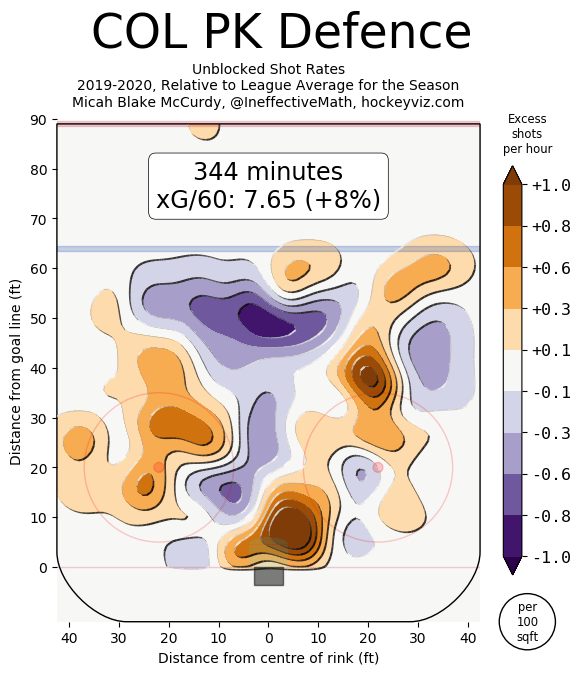
Here we see Colorado is league average in terms of where they shoot from, very good defense in terms of suppression of quality, and both special teams units not very good (and the PK quite a bit worse than expected). We’ll get into Colorado’s elite finishing ability that masks their otherwise mediocre offensive process later but for now, that’s where the Avs sit.
Let’s take a look at the Coyotes for comparison.


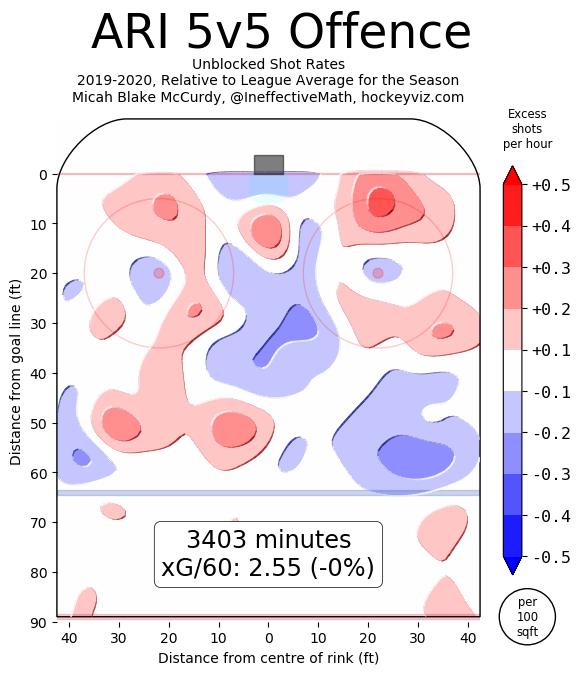
If you’re reading those charts correctly, you’re coming to the same conclusion I am: How are the Coyotes even here? Their offense is their best asset and it’s right at league average!
For a team with a defensive reputation, these were surprising numbers to stumble upon. We thought Colorado’s PP struggled to generate quality? -19% for that Arizona group is an abomination. Despite being their worst unit in terms of process, Colorado’s PK should be able to match up against a Coyotes PP that is absolutely awful in terms of quality of shots.
Even where Colorado shoots the most from on the PP matches up against where the Coyotes give up the most shots. Nathan MacKinnon was already expected to be the superstar in this series to keep an eye on but looking at this, it sets up for him to keep trying to add that one-timer to his growing bag of tricks.
Let’s take a look at some rolling charts over time, starting with the expected goals for and against formula. Blue is expected goals for, red is expected goals against. This is all about quality.
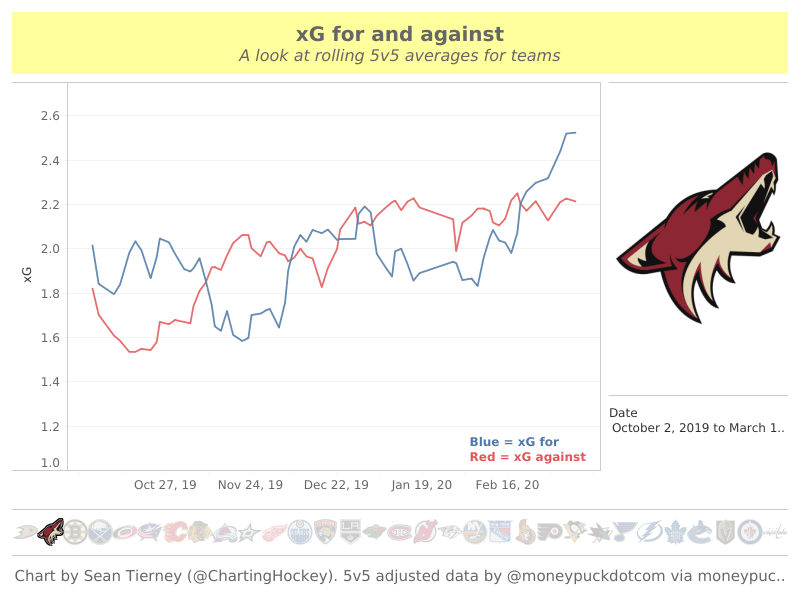
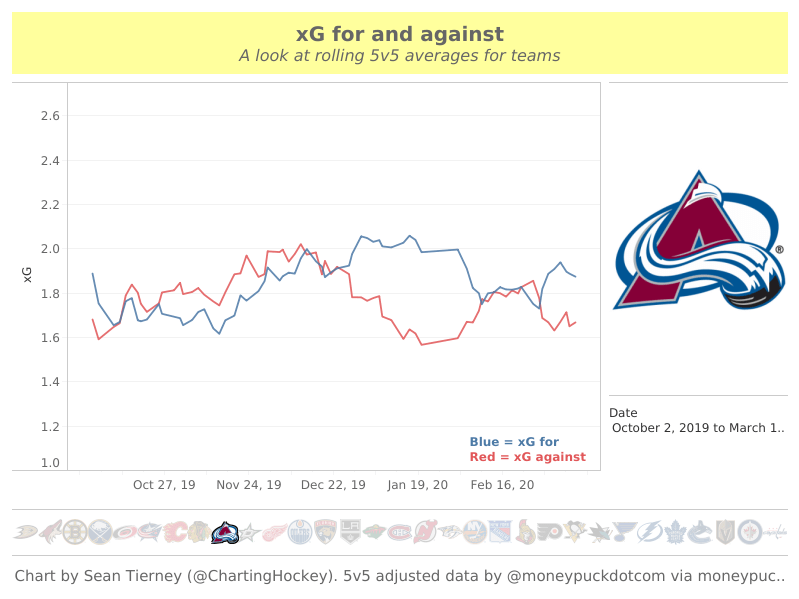
This is where it might surprise some people because the Avs were simply so mediocre in this area. They aren’t a dominant team in terms of creating quality of chances that lead up to a great expected goals for output, but as the season went along they did a better job of limiting the quality against.
Arizona, on the other hand, was a mess who only got worse. Their offense was all over the board, peaking at impressive levels but not visiting those highs very often and their quality allowed against is downright alarming.
Coyotes head coach Rick Tocchet is considered more of a player’s coach than raw tactician and I think we’re starting to see that a little bit here in how his team is playing to the installed systems.
While the Avs only briefly broke the 2.0 expected goals against mark, Arizona spent about two-thirds of their season above that line. That means they are drowning in quality chances against, forcing their goaltending to carry them.
Before getting into the goaltending, let’s stay turn our attention from expected goals to shot share. How do the Avs and Coyotes stack up in terms of dominating the shots battle?
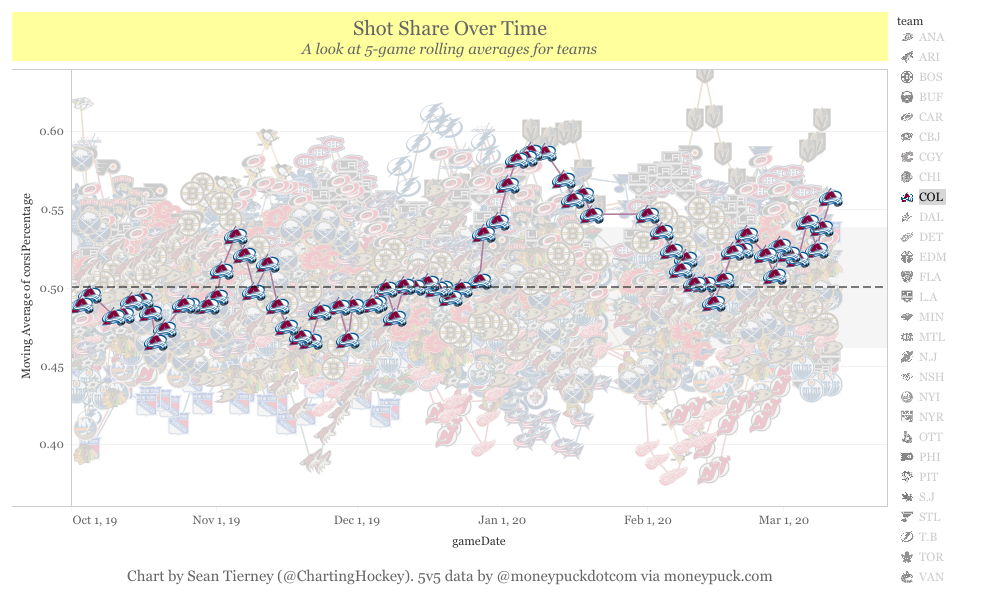
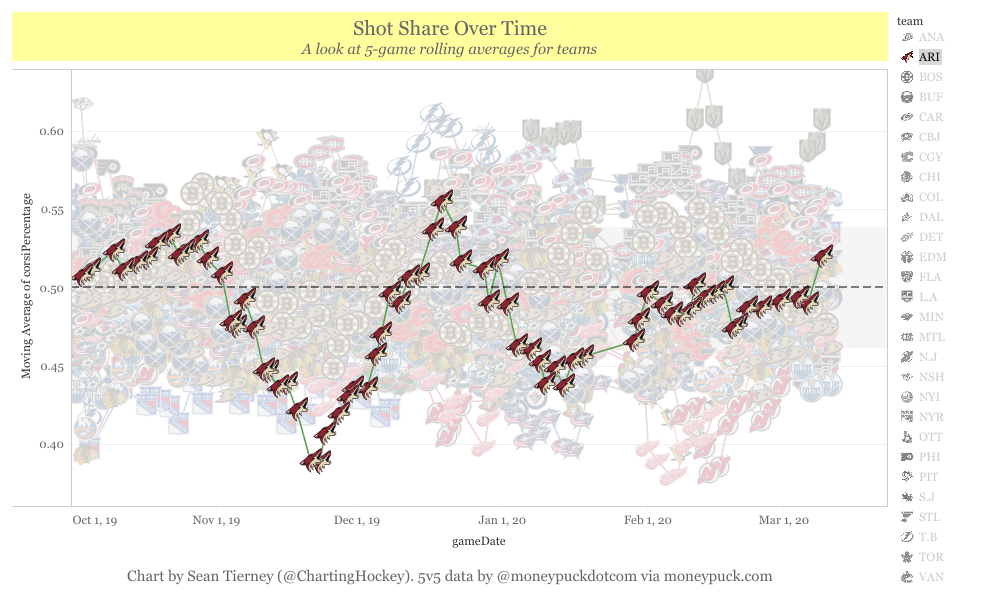
The Avs were okay early in the year and then found their footing, transitioning into one of the league’s most consistent shot share forces. The Coyotes, on the other hand, spent the majority of their season under 50%, even occasionally dipping below 45%, a mark the Avs never hit during the year.
The teams who usually do well in this are either great defensive clubs who struggle with finishing ability (think Minnesota) or the well-oiled machines built to do everything well (look at the top of the standings for these teams). Colorado blows Arizona out of the water here.
As we’ve seen so far in this postseason, however, generating shots is one thing. Getting them by a goaltender is another entirely.
That allows us to transition into taking a look at how the two teams do at scoring goals versus the quality of chances they generate. This is basically a look at a team’s finishing ability on offense and the quality of their goaltending on defense. Blue is offense, red is defense.
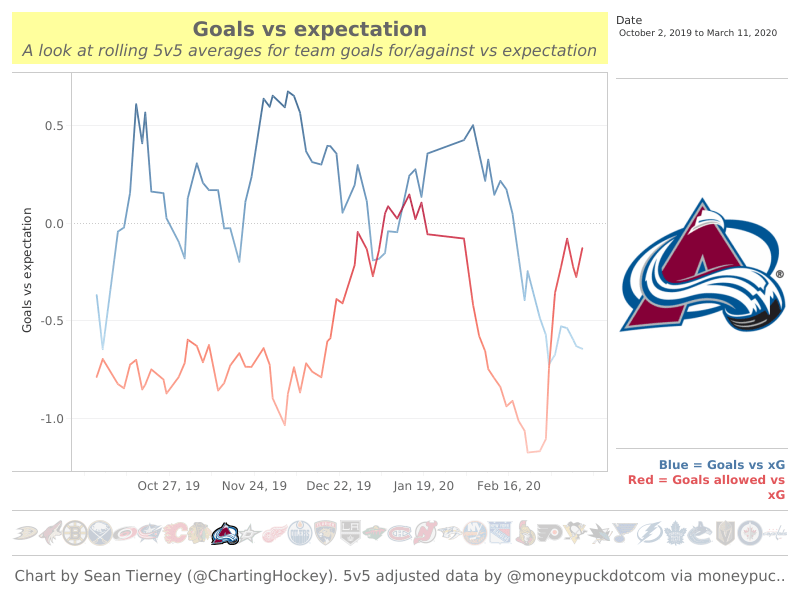
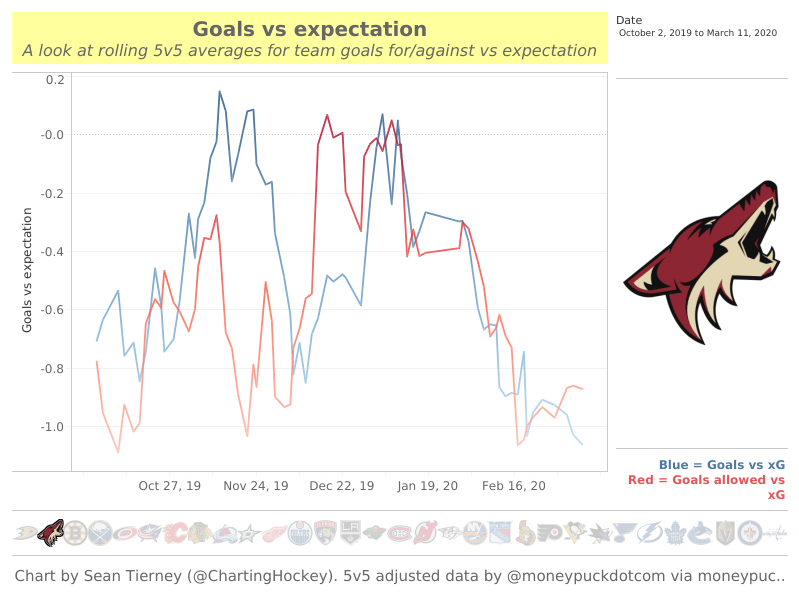
The first thing I noticed was the y-axis had to have different values to accommodate each club’s performance. The Avs had some slumps where they dropped below the zero mark, but you’ll notice the longest trend of that was in the final month of the season when their forward corps was decimated by injuries.
Other than that stretch, Colorado spent most of the year on the positive side of things, indicating they outscored the quality they generated. Defensively, the goaltending wasn’t elite for the Avs but it was rock solid and, maybe most importantly, steady for most of the year.
There was a dip in the goaltending that certainly matched the eye test beginning in late December and running through January before getting good again.
Arizona, however, spent very little time on the positive side of things on offense. It’s just not a team that has strong finishing ability and anytime they had a run of decent scoring, it proved more anomalous than an indicator of a team finding its stride.
The goaltending was downright excellent early, then struggled a bit as injuries once again beset the Coyotes, then steadily improved in the second half. Unfortunately, as their goaltending got better, their finishing ability bottomed out. The trend emerging here is one of a hockey team that just isn’t a scary scoring threat but also one not good enough defensively to get away with that kind of offensive ineptitude.
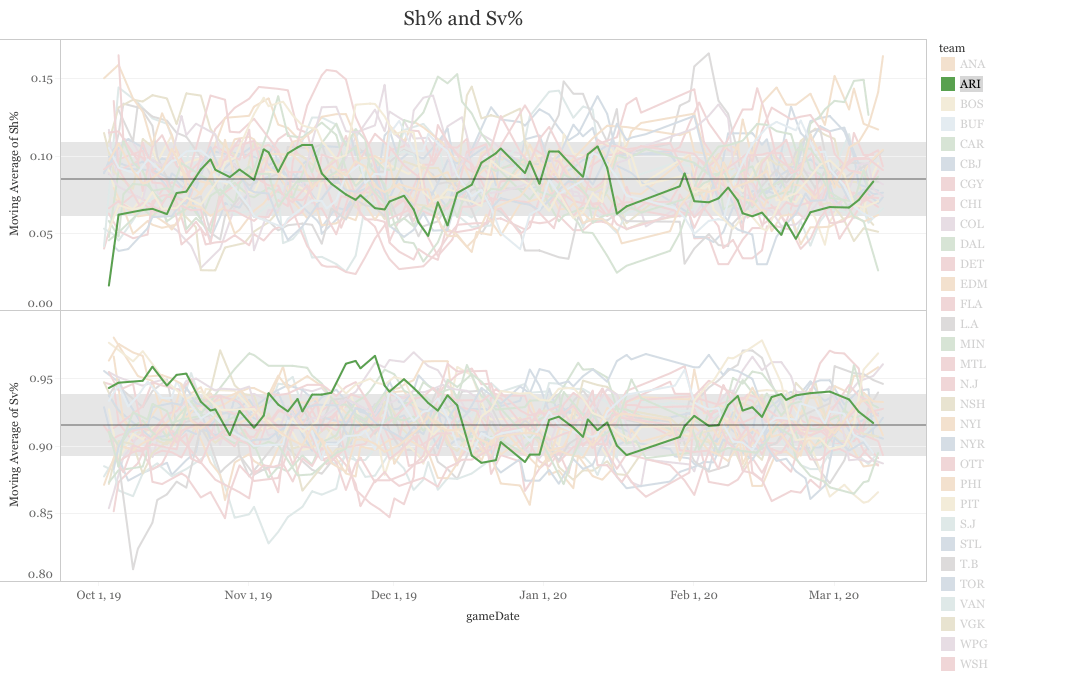
This all brings me to Darcy Kuemper, goaltender extraordinaire, versus Colorado’s offense, goal-scoring juggernaut.
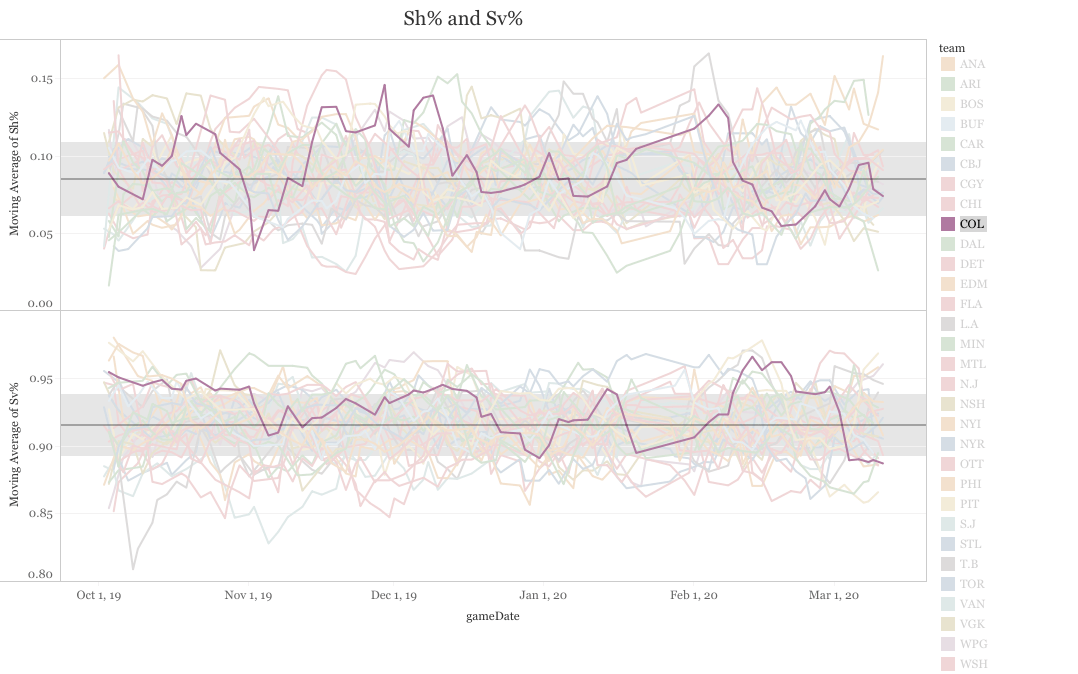
Well then.
Colorado spent most of the season above the league average line (that dark grey line cutting through each graph) in both shooting and goaltending. Regardless of the expected goals formula favored by analytics departments all over, the Avalanche was downright excellent in both raw shooting and save percentage.
It wasn’t a secret what made this Avs team tick. They scored well, they defended well, they stopped pucks well. All of the above data shows a very good team with a couple of pockmarks (iffy special teams, mediocre generation of quality chances).
On the other side of the coin, the data is showing an Arizona team that would not have made the postseason in a traditional format and road an outstanding week from Darcy Kuemper to beat a Nashville Predators team that lacks high-end finishing ability.
That’s where the rubber meets the road in this series. Colorado’s lethal goal-scoring ability against Kuemper. That’s it. That’s the breakdown.
The winner of that battle wins this series.
Comments
Share your thoughts
Join the conversation


