


If you missed Part 1’s introduction and basic stats or Part 2 covering some of the common terms found on stats sites, they’re available here and here.
There’s no doubt that statistical research has made great strides in the past decade. Even though the movement started with adding up a few shot-based stats to try to predict goals, it’s morphed into very specialized and multifaceted analysis.
For the purposes of this guide, we’ll be focusing on microstats and composite rankings. However, if you get the chance, Last Word on Hockey has a great podcast series exploring many different forms of research with some of the pillars of the stats community. (part 9’s Capology with Carolyn Wilke, which doesn’t show up in the list, can be found here).
Microstats:
What are Microstats?
Overall, we’re reaching a point where there’s not much more traditional NHL stats and scrapped data can tell us. There’s no doubt that shot-based metrics do a great job at giving us a big-picture understanding, but they’re pretty terrible at nuance and tend to leave out significant parts of the game.
Microstats try to cover some of these overlooked areas. Hockey researchers are studying passing, defensive locations, who is first to lose pucks, and a whole host of other variables that have an impact on the ice.
Unfortunately, these areas aren’t tracked by the NHL, so each game has to be manually recorded. Private companies are using camera angles and machine learning to gather their data, but most of the projects available to the public are tracked by hand in a time-intensive process.
Even so, there’s merit to the work. Improving these stats won’t take a team from 30th to 1st, but they could provide a 5-10 point bump in the standings. They also extremely helpful when talking about player roles, roster construction, and chemistry.
The Passing Project: As a team-based game, passing plays a huge role on the ice. It’s critical to transitioning from defense to offense and spreading out the defending players to create scoring opportunities. It’s one of the most critical skills for a player to possess, and it has an incredible effect on games.
It’s also not tracked at all by the NHL.
To be fair, shot-based stats take into consideration some amount of passing. If a player has good Corsi, typically good passes are happening frequently when they’re on the ice. Likewise, passing poorly leads to turnovers, shots against, and poor possession numbers.
However, players who are exceptional passers (like Joe Thornton) don’t necessarily receive the credit they’re due. A more detailed understanding of good and bad passers is also very useful when trying to figure out lineups and create rosters.
There’s a great wealth of data to be gained, but it means that tracking must be done manually. Ryan Stimpson started the Passing Project in 2013-14 to try to understand the effect passing had on his New Jersey Devils. Coming from a soccer background, he saw the value in migrating the concept to hockey.
In ’14-15, he brought on a few other individuals to help out, and they tracked almost 500 games from primarily eastern teams. He also released data for ’15-16 in Tableau form. Corey Sznajder agreed to track all the games from ’16-17, and his data is available through is pateron here.
So, what does the Passing Project track? In it’s current form, it focuses on two main areas, transition and shot assists. On transition, it looks primarily at:
- zone entries and exits (passes, carry-ins, and dumps)
- recovered dump-ins
- location of passes (left/center/right)
- the shots these passes generate
In the offensive zone, it focuses on:
- the number of passes made
- if they were 1st, 2nd, or 3rd shot assist
- where those passes were made from and where they went to
- if they fit into a category of special passes that tend to lead to scoring chances (stretch pass, home plate, low-to-high, behind the net)
This is tracked for players and teams, but also against them. Defensive stats are included too, especially for players that deny zone entries.
Zone Entries/Exits: Zone entries are players/team’s ability to move the puck from the neutral zone across the blueline and into their attacking zone.
They can either be “controlled” (carried or passed in) or “dumped” (sent below the goalline for a player to go pick up). Controlled entries generate more offense, but dumping the puck in is much easier for less skilled players to accomplish.
Zone exits are how well a player/team can move the puck out of the defensive zone and into the neutral zone.
While forwards usually have control of the puck while it’s crossing the blueline, successful breakouts almost always begin with good passes from defensemen. Therefore, the ability to retrieve the puck and clear the zone with possession is a critical skill for that position.
This understanding is beginning to reshape the way many people view the role of blueliners. For example, Erik Karlsson has a reputation of being bad at defense. He’s not on the ice for many defensive events, and plays most of his ample minutes on offense.
However, he’s excellent at getting possession of the puck and passing it out of his defensive zone. His traditional defensive numbers might not be great, but that’s because he shuts down teams before they’re able to set up and prevents defensive plays from happening at all.
Understanding the plays that didn’t happen is often as important as understanding those that did. Quantifying defensive play has always been very difficult for this reason, but zone exits are one of the best stats available for piecing together the overall talent of a blueliner.
Pass-Based Shot Types: Another way to analyzing passing project data is understanding how passing in the offensive zone affects shot quality. There are some passes in particular that tend to increase the likelihood of a shot hitting its mark. They are:
- Stretch passes, made from one end of the ice to the other
- Home plate or “Royal Road” passes
- Low to High, or passing from near the net out to someone in the medium danger scoring zone
- Behind the Net passes – someone setting up in “Gretzky’s Office” behind the net and making plays to open teammates or areas of the ice
Steve Valiquette from Hockey Night Live breaks down some of these concepts in this video. He ranks shots into red, yellow, and green categories based on the passing play that proceeded them. Red shots, especially those that cross the “Royal Road” are particularly hard for goalies to stop because it involves moving post to post very quickly.
He’s not the only one. Adam Wells, more commonly know by his Twitter handle @loserpoints, also looked at pass-based shots and shot assists and determined a weighting system for them. His visualizations from the ’15-16 season can be found here.
Forechecking Project –
Since Corey Sznajder took over the Passing Project tracking, Ryan Stimpson has been focused on another microstat tracking. The Forechecking Project focuses on how teams apply pressure while forechecking, or trying to get the puck back from the other team before they complete a zone exit. The project aims to look at the flip side as well, analyzing breakout strategies and which are the most effective.
One of the focuses is how defensemen are activated during forechecking. Traditionally, their job on the forecheck was to hurry back to near their goalie and prevent any odd-man rushes from occurring. However, the Czech team at the most recent World Junior Championships used their defensemen in a more active role against Canada. Their aggressive team-based approach proved effective for a while, so it did provide an interesting case study for possible future gain.
Clustered Playing Types – Stimpson hasn’t only been concentrated on forecheceks, however. Some of his other recent work is taking passing data and using computer algorithm to help him cluster players into playing types.
The hockey world has talked about archetypes like “playmakers” and “all-around defensemen” for as long as the game has been around. However, where to draw the lines on what exactly makes a player fit into that mold is hard to quantify. Stimpson looks at data in seven areas:
- Shot Index (individual shots)
- Shot Assist Index (primary shot assists)
- Build Up Index (secondary and tertiary shot assists)
- Transition Index (controlled entry assists)
- Danger Index (Shot Contributions from below the end line or across the slot)
- Influence Index (Total shot contributions)
- Pass Index (Total shot assists)
As you can see, around half of these numbers reflect Passing Project data, and the other half incorporate more traditional shot and goal-based data. Once this data is entered, cluster analysis groups the players into categories based on their numbers.
Forwards can be Balanced, Dependent, Playmakers, or Shooters. Defensemen are Puck-Movers, All-Around, Volume Shooters, or Defensive-Oriented.
These terms are fairly straight forward: playmakers/puck-movers rank high in passing categories, shooters/volume shooters are high in shooting categories, balanced/all-around are good in both, and dependents/defensive-oriented rely a lot on their linemates to generate their offense.
A visualization of this data can be found here.
It should be noted that a player type doesn’t reflect on how good a player happens to be. For example, Patrick Kane and Jack Skille are both considered “shooters”. There are a number of other variables that need to be looked into, but playing types helps understand the roles and tendencies of players.
However, when taken a step further, each type has a weighting that can be applied to the expected goals stat. This works on an individual level, as well as on a line/pairing level. By looking at past results of lines comprised of certain player types, Stimson found which combinations were likely to score more. Essentially, it’s an attempt to quantify line chemistry.
Sean Tierney has been taking a look at creating a viz for optimal lineups based on playing types. It’s still in production, but he’s posted many of them to his Twitter, including this one:
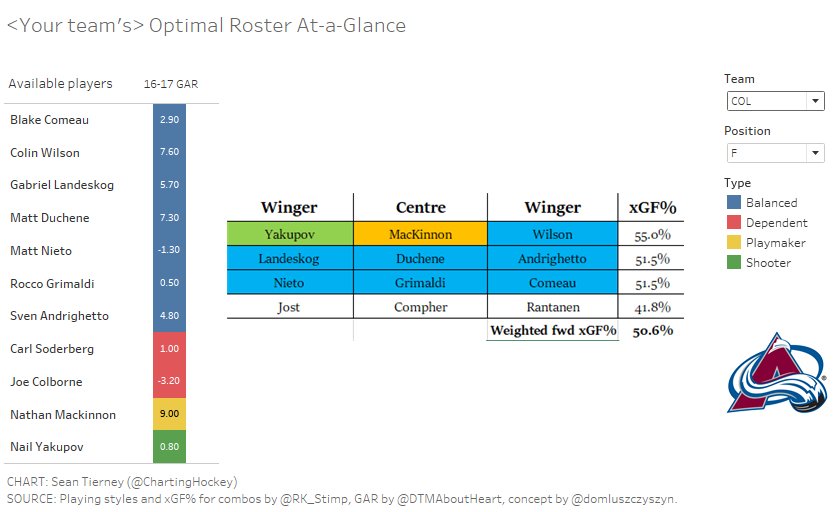
Even though he isn’t shown on the chart due to small sample sizes, Rantanen is a Balanced forward. He, Jost, and Compher are all highly unlikely to be playing on the 4th line, but until they reach the cutoff, Tierney penciled them in at the worst case scenario of “dependent”, so this ranking will almost certainly improve once more data is added.
Also, Tierney hasn’t looked at the Avs defense yet, but Erik Johnson and Tyson Barrie are considered “All-Around defensemen”, Nikita Zadorov is “Defensive-Oriented”, and Mark Barberio is a “Volume Shooter”.
Composite Rankings:
As experienced in part 2 of this guide, “how good is player x?” is a very complex question. There are a lot of different stats, but which are the most important? How should they be prioritized, ranked, and complied?
Baseball has a stat called WAR, or wins above replacement. It’s a composite ranking that factors in a whole host of different variables and predicts how many more wins the skill of the player will bring in above a replacement level or injury call-up player. Since baseball is much easier to break down statistically, it’s data is much clearer and has been tracked for much longer.
Hockey’s fluid structure has always made copying that structure very difficult. One of the earliest attempts was Delta Corsi, or the difference in expected Corsi vs actual Corsi. Context factors such as age, time on ice, quality of teammates, and zone starts created the expected Corsi, and dCorsi told us how well/poorly a player did above their expected value.
Game Score, which was introduced in Part 2, is also a composite ranking. Like dCorsi, it draws on a fairly small pool of variables and weights them to come up with a value. Game Score’s advantage is that it works over a short term for evaluating individual games as well as in the long run, plus it’s fairly straight forward and easy to understand. Unfortunately, it’s based entirely on shot- and goal-based stats, so it ignores a significant part of the game and does not take into account shot quality.
As computer modeling improves, more and more variables are being added into models. At the moment, there are three fairly detailed stats attempting to answer these questions.
Corsica K: Developed by Emmanuel Perry (the head of the Corsica stats website), K measures how much better or worse a player is against the average NHLer.
The number involves four areas: rate of shots, expected goals, rate of penalties, and strength state (5v5, power play, shorthanded, etc.). Each is run through a computer to figure out how each value will likely regress based off history, then added up to figure out how many goals above/below average a player (or team) contributes.
At the moment, K is unavailable, but it should be back up and running when Corsica relaunches within the next couple months.
Wins Above Replacement (WAR) / Goals Above Replacement (GAR): Wins Above Replacement is based on Goals Above Replacement, so most of this paragraph will focus on how GAR is calculated. Both stats are the brainchild of Dawson Sprigings.
The first thing to know is that GAR is very similar to K, but it looks at how good a player is in comparison to a “replacement level player” (injury call-up) instead of against an average NHLer. It also ties in many more variables than K using complex computer regression modeling, including weighted totals from the past three seasons.
In the end, it figures out how players (or teams) do in six categories:
- even-strength offense
- even-strength defense
- power-play offense
- drawing penalties
- taking penalties
- faceoffs
Through that, it calculates how many goals above a waiver-level player are added or subtracted based on each of those categories. Add up the goals from each category, and you end up with GAR.
WAR is based on how many goals are needed to win a hockey game based on the season, as calculated here. However, there’s only so many wins to go around, so WAR points are broken up among each of the six GAR categories according to how often they happen in the game and who contributes (forwards, defensemen, goalies).
If you’d like the full course on how GAR and WAR is calculated, here’s part 1 (an intro), part 2 (shot attempt context), part 3 (goal/assist context), part 4 (blending the systems and weighting past seasons), and part 5 (wrap up). If you’d like to see all the data, it’s available here.
However, I’d argue that the best way to really start to understand GAR is to play with this visualization from Sean Tierney.
Weighted Points Above Replacement (wPAR): One of the drawbacks to GAR is that it’s extremely complex and relies very heavily on advanced computing and algorithms to generate numbers. It’s still very useful due to its accuracy, but unless you have a stats background, it’s very difficult to understand how it was constructed.
That’s where the new weighted points model comes in. It’s a bit like a cross between Game Score and GAR, since the entire purpose of this metric is to provide an “above replacement” ranking using common stats. It includes five areas:
- Counts: goals, primary assists, secondary assists, individual missed+blocked shots, individual expected goals for, and some interaction variables
- Relative Corsi
- Penalties Taken
- Penalties Drawn
- Faceoff Differential
It then finds a coefficient for each and how they relate to points, then scales the entire number down to actually look like points totals. The author, Luke Solberg, then calculated the equivalent of a replacement level player and compared the weighted points results to that baseline to generate the wPAR stat.
The full data set can be found here. Since wPAR was only released in early August, to my knowledge, there is no visualization form of it yet.
Fun Visualizations:
Most of these stats are fairly new, so visualization is still catching up. However, Sean Tierney’s Tableau page is an excellent resource for all sorts of interesting stats.