© 2025 ALLCITY Network Inc.
All rights reserved.

How are successful hockey teams built? Sure, they have talent, but how is that talent acquired, retained, and renewed throughout the years? Is there some form of roadmap for rebuilds, blueprints for building wins? And where do the Avs stack up in all of this?
Welcome to BSN Denver’s summer series, (De)Constructing Contenders. In order to answer some of these questions, an in-depth look at successful teams was needed. To set the baseline, the complete trade trees for the past 39 Stanley Cup winners and all of the conference finalists since 2006 have been compiled and analyzed. Those trends will then be applied to the assessment of all 30 current clubs in the NHL to shed light on whether or not each organization is on a path to success.
In total, 95 teams will be represented over the course of this project.
Before jumping into the fun stuff, an introduction into the terminology and presentation format is probably wise. Most of this is fairly self explanatory, but the areas that might prove confusion are bolded for easy skimming.
For those still reading, the focus of this study is divided into two distinct categories:
- Current assets are the players on the team and how they were directly acquired.
- Primary assets are the termini of trade trees and represent the base building blocks of the team.
Over time, current assets show what team building trends are popular for that era – draft based teams, trade based teams, etc. – and primary assets show how the team internally gathered the talent necessary to create a winning organization. Both are useful when it comes to understanding construction philosophies and making team-to-team comparisons.
Beyond that, both the current and primary assets are subdivided into seven acquisition methods:
- Primary draft picks (P. Draft) are the picks given to each team by the league every year. They’re represented by light blue on the “Current Assets” graph and all of the blue in the next two pies.
- Traded draft picks (T. Draft) are players whose picks originally belonged to a different team. Compensatory picks also fall into this category. As non-primary assets, they’re only seen on the “Current Assets” graph in bright blue.
- Traded players are drafted or established players that came to the team via a trade. They are not primary assets, although their roots eventually trace back to them. These players are shown via the large light grey slice near the bottom of the “Current Assets” graphs.
- Unrestricted Free Agent (UFA) signings are drafted and/or established players who have signed a contract with the current team. They’re considered primary assets since the club didn’t have to give up another asset to get them. Restricted free agents (RFAs) that required a form of compensation to be sent to their original team are considered traded assets, not UFAs. As a primary asset, UFAs are shown in a mid-tone grey throughout all the graphs.
- Undrafted signings are players who were signed to an entry level contract by the team. They weren’t drafted and haven’t played in the NHL, so their youth and unknowns help separate them from their more established UFA brethren. As a primary asset, they’re depicted in a darkish grey throughout the graphs.
- Waiver claims (and occasionally Waiver Draft picks) are the darkest grey slices on the graphs. When an established NHL player is sent down to (and before 2012, called-up from) the minors, each team gets a chance to add him to their NHL roster instead. They don’t have to give up any form of compensation, so waiver claims are considered a primary asset.
- Other is a broad category covering everything from expansion drafts, inter- and intra-league drafts, Original 6 era C-forms, claims, agreements, cash transactions, and ominously hanging “future considerations” at the end of trade trees. It’s rare to see many of these primary assets in the modern day NHL, but they were quite common for teams built during the ’70s and ’80s. They’re represented by a lightish grey located near the top left on each of the graphs when applicable.
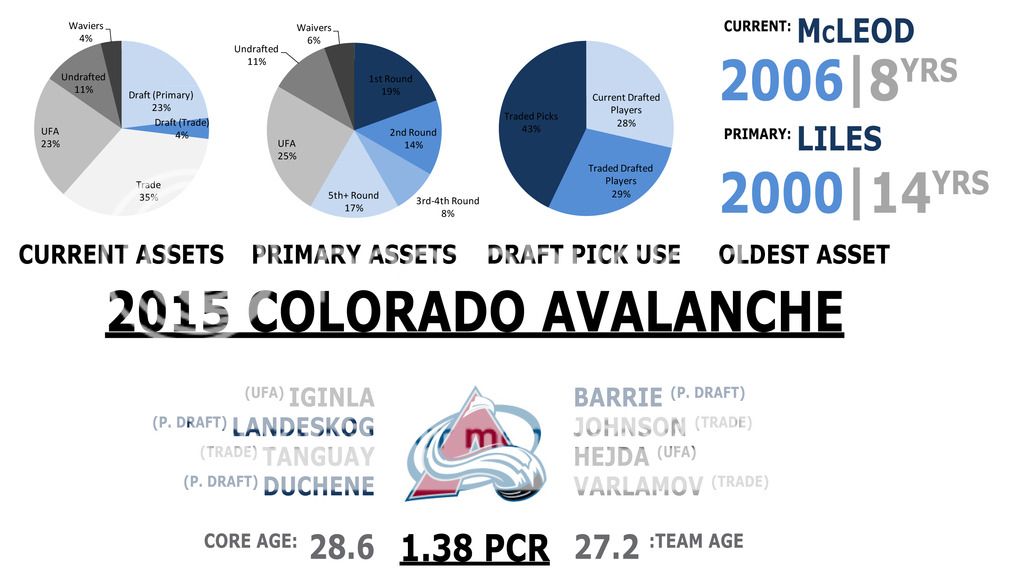
In each writeup, every team will have an overview that looks like this:

The top row represents the team’s building strategies. From left to right:
- The “Current Assets” graph represents the current mix of primary and non-primary assets on the roster.
- “Primary Assets” is all about the roots of trade trees. Here, primary draft picks are split into 1st, 2nd, 3rd-4th, and 5th+ round slices, show in lightening shades of blue. It also shows how much the team has relied on UFAs/draft picks/etc over the course of the current build.
- “Draft Pick Use” shows the percentage of drafted players still with the team (light blue), drafted and traded away (bright blue), or traded as draft picks (dark blue). Did the team draft and develop, or did they use picks as currency for immediate help?
- “Oldest Asset” highlights the player that’s been with the organization the longest (in the Avs case, it’s Cody McLeod) and the oldest asset still represented on the team. Since the team’s 2000 sixth round pick (John-Michael Liles) is present in Semyon Varlamov’s tree, he’s the one that earns that honor even though he’s no longer on the roster.
It should be noted that the year listed is always the Stanley Cup year for the team. In reality, this is the 2014-2015 Colorado Avalanche, but the shortened form helps keep the nomenclature consistent between the playoff and non-playoff teams.
From there, the “core” of the team is listed with their color-coded acquisition type. The four top scoring forwards are to the left of the logo, and three defensemen and a goalie are listed to the right. If TOI data is available, the defensemen are typically the top minute-munchers. If not, it’s based on scoring. The goalie is the one with the largest number of games played.
- (P. Draft) is short for Primary Draft Pick and shown in a dark blue text.
- (T. Draft) stands for Traded Draft Pick and is shown in a bright blue text, when applicable.
- (Trade) is always in light grey.
- (UFA) and (Undrafted) are both in dark grey.
- (Waivers) and (Other) are both in black.
- For playoff/Stanley Cup teams, these represent playoff data only. For non-playoff teams like the 2014-15 Avs, they represent regular season data.
- The names listed may or may not align with the traditional definition of a “core”. In a general sense, Iginla and Tanguay probably wouldn’t be considered a part of the nucleus of the Avs, but they still outscored players like O’Reilly and MacKinnon last year. For the sake of this analysis, that makes the vets, not the kids, the current core players.
Near the bottom, “Core Age” is the average age of all eight core players, and “Team Age” is the average for the entire roster. The Primary/Current Ratio (PCR) is the number of primary assets divided by the number of current assets. Trade based teams will have a much higher PCR than non-trade based ones. More mature clubs further away from their initial rebuilds will typically have a much higher PCR as well.
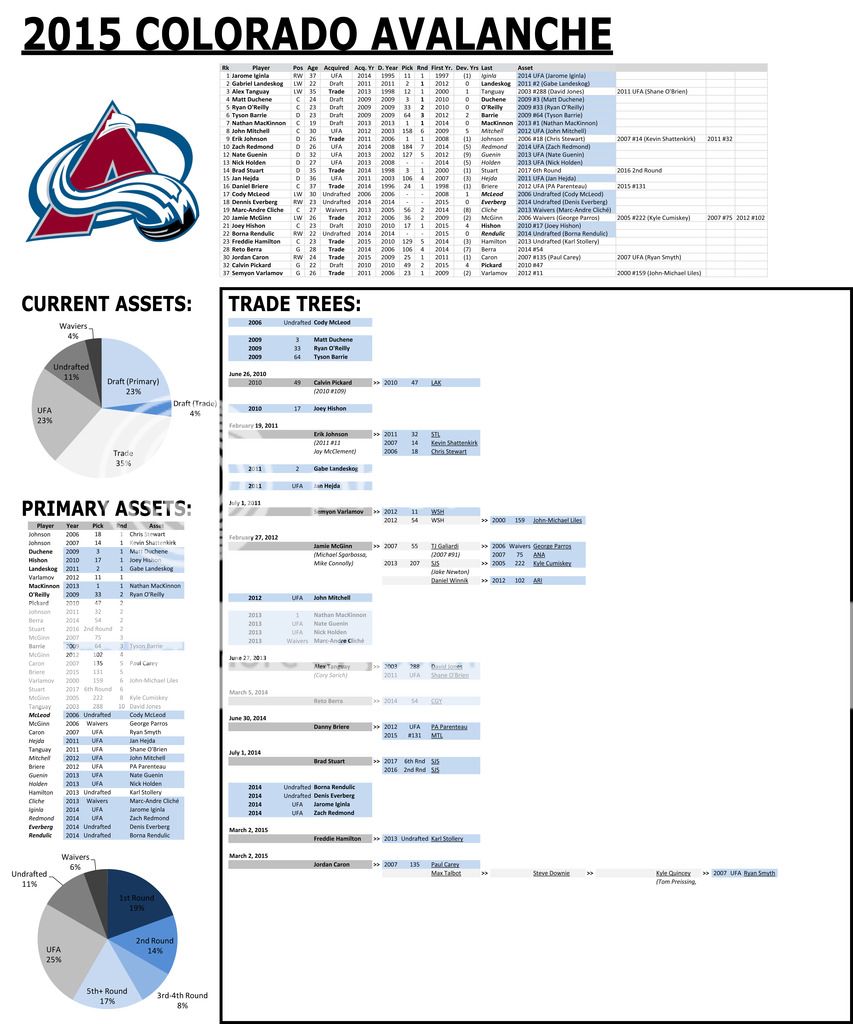
In addition, a link like this one: 2015 Colorado Avalanche Data Sheet will be provided beneath the overview image and near the paragraph in which the club is discussed. When clicked on, it opens this:

The graphs are a repeat of the “Current Assets” and “Primary Assets” from the overview image, but the full roster, asset breakdown, and trade trees are shown. A couple brief notes:
- Any blue highlight indicates a primary asset.
- Other players acquired through the trade that don’t directly contribute to the tree are shown in italics.
- Draft picks are presented in a “Year Pick Player” format. If the pick was traded, the abbreviation for the team that now owns it will be shown instead of the Player data.
With that through introduction out of the way, stop back tomorrow for the first Stanley Cup winner breakdown of the Dynasty Years (1976-1990).
Comments
Share your thoughts
Join the conversation


