© 2026 ALLCITY Network Inc.
All rights reserved.

Clutch is a thing. It’s Nolan Arenado’s thing.
There are those who would have you believe that there is no relationship between Arenado’s astronomical RBI totals and any kind of measurable skill, but those people would be wrong. They are wrong with the best of intentions. They are wrong with a great deal of knowledge in their corner. But they remain inextricably, undeniably, emphatically, and more than a little bit ironically, wrong. Projectable and measurable are two different things. And Arenado has been measurably clutch.
Let Mortal Kombat begin:
Player 1: .294/.362/.570, 41 HRs, 133 RBI
Player 2: .292/.385/.554, 39 HRs, 102 RBI
Looking at those statistics out of context and with traditional baseball eyes, one would surely arrive at the conclusion that the first player was more valuable. He drove in far more runs and was better in every other way besides drawing a negligibly fewer number of walks. But when it is explained that the first player accomplished what he did in Coors Field, and the modern attitude toward RBI is applied, all of a sudden you have almost a slam dunk case in favor of Player 2. Throw in Kris Bryant’s role on a postseason club that went on to win it all, and is there really any debate that Player 2 was better?
Well, yes there is.
Mike Trout’s MVP win proves that a certain amount of production can overcome a lack of wins. And while Player 1 (obviously Nolan Arenado) is disliked by the weighted rate stats in most cases, they absolutely love him when the game is on the line. Failing to recognize this has left Arenado as one of the most underrated players in baseball.
After all, isn’t the most important stat in baseball still to score more runs that the other guys in any given game?

While debates rage on about the merits of advanced statistics versus their more traditional counterparts, somewhere something got lost in translation about what we were trying to measure to begin with.
Saying “RBI is a bad stat” or “hitting less than .300 at Coors Field is disqualifyingly unimpressive” is exactly the kind of short-sighted thinking that the sabermetric movement was designed to topple in the first place. Similarly, claiming whatever version of WAR you subscribe to as the ultimate arbiter in an MVP debate when you know WAR is reliant upon systems that often take multiple years to gain accuracy is intellectually lazy despite use of complicated metrics.
Context remains king.
For those who do not dismiss RBI out of hand, this article is likely to be nothing more than preaching to the choir, pointing out advanced mathematics that show what you have already witnessed with your own two eyes. But for those who prefer not just numbers, but a very particular kind of number, BSN Denver presents the relevant stats you should have been looking for while instead dramatically underselling the talents of Colorado’s phenom third baseman.
Let’s look at a few charts. The first shows the sOPS+ (or OPS adjusted to ballpark and weighed against the rest of the league) for some of the best players in their best seasons over the last several years:
| Player/Year | RISP
sOPS+
|
Men On | < 2 run game | 2 out w/ bases loaded | Late & Close | Non-weighted OPS | Team Ahead | Team Behind |
| Nolan Arenado/2016 | 212 | 181 | 156 | 482 | 187 | 1.214 | 173 | 136 |
| Kris Bryant/2016 | 122 | 147 | 135 | -100 | 119 | .840 | 180 | 98 |
| Mike Trout/2016 | 184 | 156 | 184 | 307 | 142 | 1.072 | 204 | 148 |
| Troy Tulowitzki/2010 | 172 | 153 | 153 | 41 | 86 | 1.034 | 173 | 113 |
| Miguel Cabrera/2013 | 259 | 232 | 222 | 301 | 138 | 1.311 | 185 | 193 |
There are a ton of interesting tidbits here, not the least of which is gaining a whole new appreciation for Miguel Cabrera’s 2013 MVP, Triple Crown season. Holy damn.
Also, if one is disinclined to accept these stats on face value and would prefer their own eye test, one might take a look at Troy Tulowitzki’s 2010 — a very good year for the talented shortstop — and feel like these numbers track. Even at his best, Tulo was never known for being clutch.
Further, you’ll note that Arenado’s 2016 comes in second (to Cabrera) in three categories including sOPS+ with RISP and with men on. Additionally, under the “Late and Close” category, Arenado holds a wide lead. In order to find a comparable player with better numbers there, you have to go back to Alex Rodriguez who put up an eye-popping 204 in 2007. Additionally, Adrian Beltre put up a 202 mark in that category in 2004. Those seasons from A-Rod and Beltre were the third and second highest rated seasons by fWAR at third base in MLB history.
Arenado leads, by a decent margin, in production with the bases loaded and two outs, the highest leverage situation in the game of baseball; where an out means a huge win for the opposition and a hit can mean as many as four runs. I haven’t done a search of everyone in MLB but his 482 mark is the best I’ve found, including Barry Bond’s in 2002.
This is all a long-winded way of saying that Nolan Arenado, by rate, had one of the most clutch seasons in recent memory and the tighter the situation, the better he performed. He wasn’t just good in the clutch in 2016, he was Almost-As-Good-As-Triple-Crown-Miguel-Cabrera-And-In-Some-Ways-Better in 2016.
You can draw your own conclusions about all the red in Kris Bryant’s column.

While many in the national media were dismissing his RBI during MVP debates, they were unwittingly scoffing at Arenado’s greatest offensive accomplishment.
But, they might contend at this point, that is just one season and still subject to quite a bit of randomness.
While I still believe MVP ought to be considered based on single-season accomplishments and not projectable skills, I nonetheless grant the premise (especially in the bases loaded, two out category) that the sample size is relatively small which brings us to our second table:
| Player career | RISP
tOPS+ |
Men On | < 2 run game | 2 out w/ bases loaded | Late & Close | Non-weighted OPS | Ahead | Behind |
| Nolan Arenado | 131 | 122 | 109 | 202 | 80 | .979 | 99 | 94 |
| Kris Bryant | 96 | 114 | 93 | 98 | 81 | .874 | 113 | 77 |
| Mike Trout | 114 | 100 | 101 | 100 | 80 | 1.027 | 107 | 96 |
| Troy Tulowitzki | 102 | 98 | 102 | 73 | 64 | .869 | 105 | 92 |
| Miguel Cabrera | 108 | 106 | 102 | 135 | 90 | .993 | 111 | 92 |
Disclaimer: tOPS+ measures the player against himself where sOPS+ measures the players against the league. But at least in this case we get a look at each of the players over the course of their entire careers. Also, for those who believe that clutch is not the presence of something, but rather the lack of a drop off in certain situations, it provides an interesting roadmap.
The considerable lead that Arenado has in tOPS+ should not be confused for definitive proof that he is more clutch than those he is compared to here. Remember, that stat compares the player to himself. What it does show, though, is arguably the best explanation for the disparity between the way Arenado is seen by those who watch him regularly, and by those who do not.
He plays to the absolute best of his abilities in the clutch.
Outsiders see a guy hitting .290 at Coors Field and find that underwhelming, while Rockies fans see a guy they want at the plate with the game on the line – and with good reason – no matter what the batting average reads. As these stats show, over the first four years of his career, Arenado has been two or three times as productive as his normal self when he steps in the box and sees ducks on the pond. It’s the fullest .290 possible.
Meanwhile, Troy Tulowtizki hit .315 in 2010 but was worse than Arenado in every single clutch category we have stats for to the surprise of absolutely nobody.
It’s worth pointing out that the only two categories, in both tables, that Arenado comes out the low man on the totem pole is when his team is ahead.
It’s also interesting to note that all of these great players perform worse than their normal selves in the “Late and Close” category, presumably because of the proliferation of high-end closers and specialists. Another thing worth noting is the tendency for these stats to even off over time, which could well mean a reduction for Arenado moving forward. We certainly can’t expect him to be this good — and this much better than his normal self — in the clutch forever.
****
So, what does all this mean? For the time being, I am comfortable reaching the following conclusions.
First, projectable or no, Arenado has performed extraordinarily well in any possible definition of “clutch” over the last several seasons.
Second, this is not the result of incurring an inordinate number of at-bats with runners in scoring position (or on base) or being especially lucky but rather in excelling by rate given any opportunity to drive in runs. In other words, his high RBI totals are not by accident of happenstance but by the now four-year trend of Arenado outperforming both the rest of the league, and especially himself, when it matters most.
Third. Given this increasing set of data, we really ought to avoid the mistake, moving forward, of dismissing high RBI totals without first looking at these numbers unless we are willing to stipulate that driving in runs in high-leverage situations is not valuable to winning baseball games.

The statisticians who see the above tables and don’t buy this argument will see nothing more than statistical noise and cherry picking, though throwing out RBI is a kind of cherry picking in and of itself. But Rockies fans who look at those numbers will see the most believable gap possible between a Troy Tulowtizki who put up 5.6 fWAR in 2010 and Nolan Arenado who put up 5.2 fWAR last season. Few, if any, would trade the latter for the former.
Maybe we can’t just treat run production — actual measurable run production — as statistical noise.
It’s tough to prove “random” and even harder to prove luck but an even more difficult task would be convincing those who have seen him play on an every day basis to pick anyone in baseball other than Arenado to pick up a stick with the game on the line.
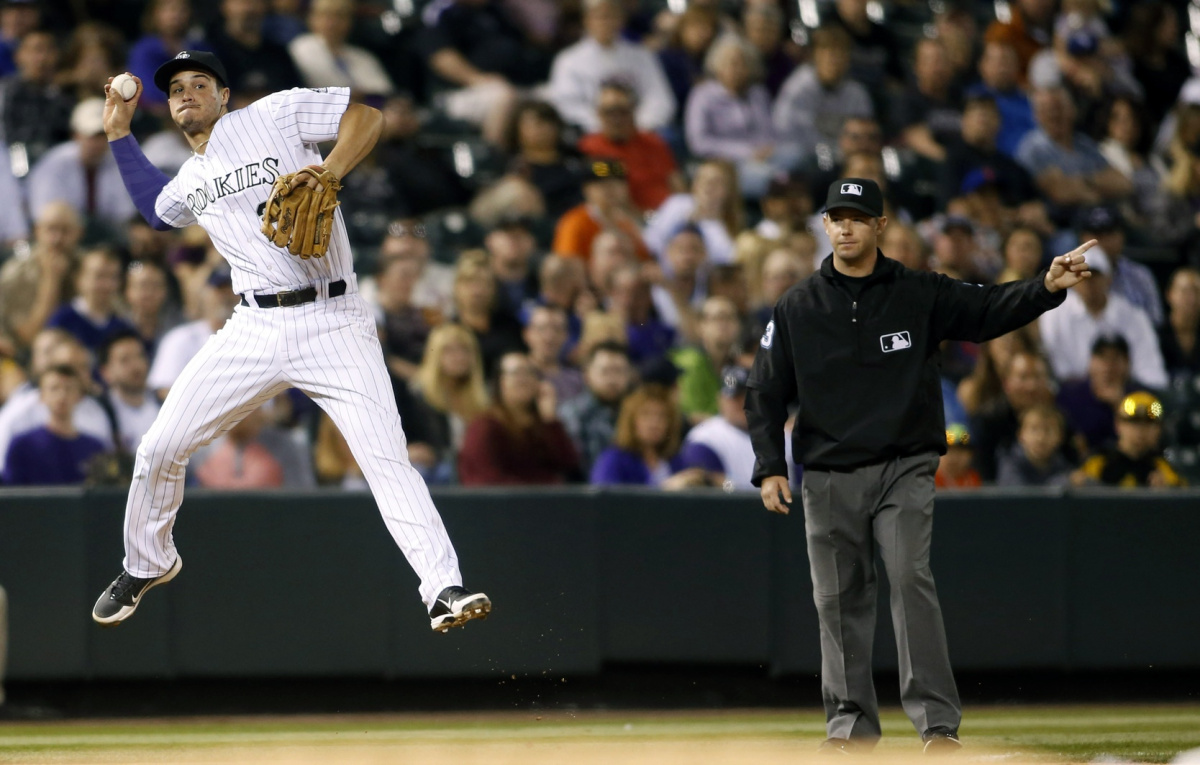
Oh, and the guy has won two consecutive Fielding Bible awards, making him not just the best third baseman in the game with four straight Gold Gloves, but also the best overall defender in all of MLB for two years running. And he is the most clutch hitter?
So why can’t Nolan Arenado bust the Top 3 for MLB Network’s list of third baseman of for NL MVP voters? Doesn’t feel right?
Watch him more. Trust me, it feels good.
Comments
Share your thoughts
Join the conversation


